. 2015 Sep 7;4:e08440. doi: 10.7554/eLife.08440

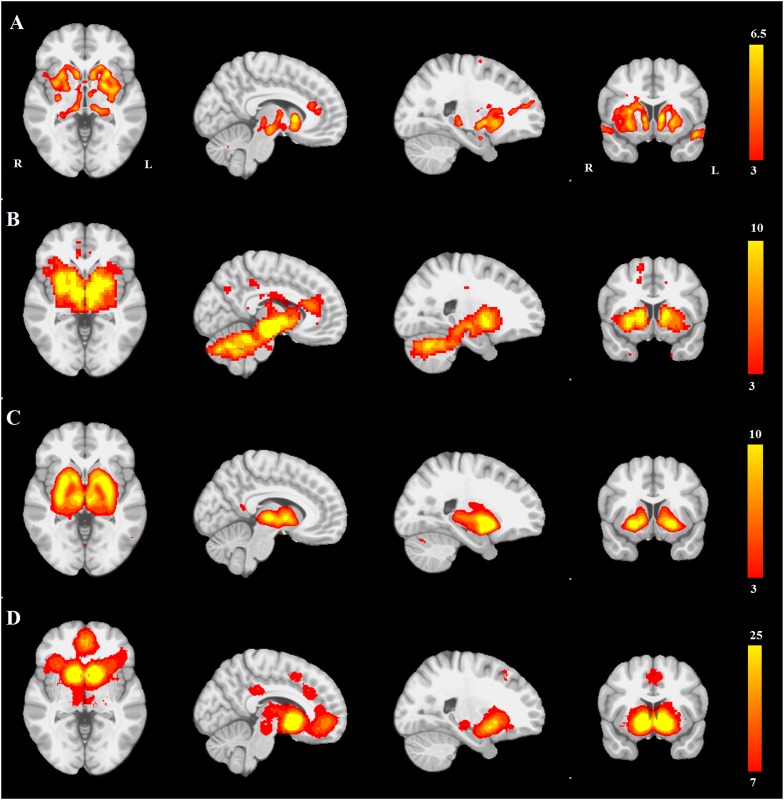
Figure 3. PD atrophy resembles normal intrinsic connectivity networks.

Selected sections for (A) PD-ICA network from the Parkinson's Progression Markers Initiative (PPMI) data set thresholded at z = 3. (B) Seed-based resting-state functional MRI (fMRI) connectivity with substantia nigra as a priori seed. (C) Intrinsic connectivity network (ICN) correlated with PD-ICA from Smith et al. (2009). (D) Regions responding to stimulus value during fMRI (meta-analysis of Bartra et al., 2013) (Selected slices in MNI space z = −2, x = −8, x = −23, y = 10.)

DOI: http://dx.doi.org/10.7554/eLife.08440.011

Figure 3.

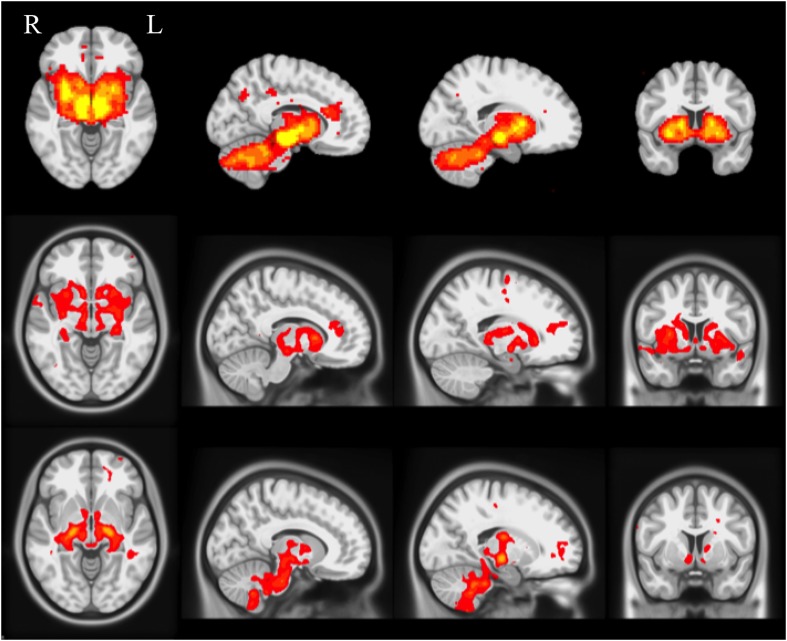
Figure 3—figure supplement 1. Selected slices for seed-based resting-state fMRI analysis results with SN as a priori seed (top), PD-ICA network from the PPMI data set (middle), ICA network consisting of white matter areas in basal ganglia and cerebellum (bottom).

Figure 3—figure supplement 1.

(Selected slices in MNI space z = −2, x = −8, x = −23, y = 10).
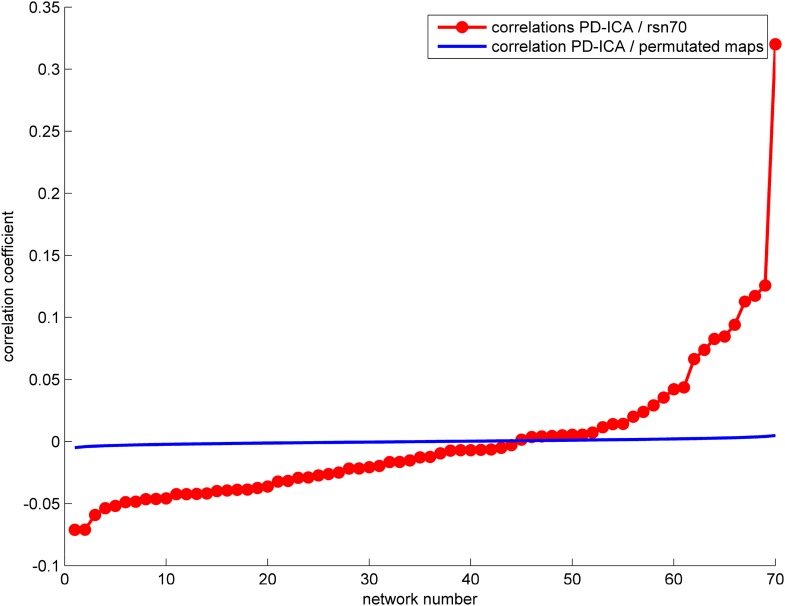
Figure 3—figure supplement 2. The correlation between the PD-ICA network and the 70 ICNs from Smith et al. (2009) is displayed in red.

Figure 3—figure supplement 2.

The highest correlation ICN is depicted in Figure 3A. We generated random ICNs by reassigning the voxel coordinates of each of the 70 ICNs and measured the spatial correlation of each permutated ICN with the PD-ICA network. This was repeated 1000 times to generate a mean correlation and confidence interval, depicted in blue.
Figure 3—figure supplement 3. Correspondence between the PD-ICA network and resting-state networks (RSN) from the Human Connectome Project (HCP).

Figure 3—figure supplement 3.

We used the 100 component parcellation of RSNs available at db.humanconnectome.org (https://db.humanconnectome.org/megatrawl/index.html) generated using MELODIC software. The bottom left panel shows the overlap/similarity between the PD-ICA network and each of the 100 RSNs. The top 4 RSNs in terms of both correlation and Dice coefficient are displayed in the bottom right panel along with a hierarchical clustering of all 100 components (top panel) based on correlation of fMRI time series from each RSN. This shows that the four RSNs belong to the same cluster, supporting the notion that they form an intrinsically connected network. Moreover, permutation testing among the 100 RSNs demonstrated that the fMRI time series from the 4 RSNs of interest were significantly correlated with each other (p < 0.0016).