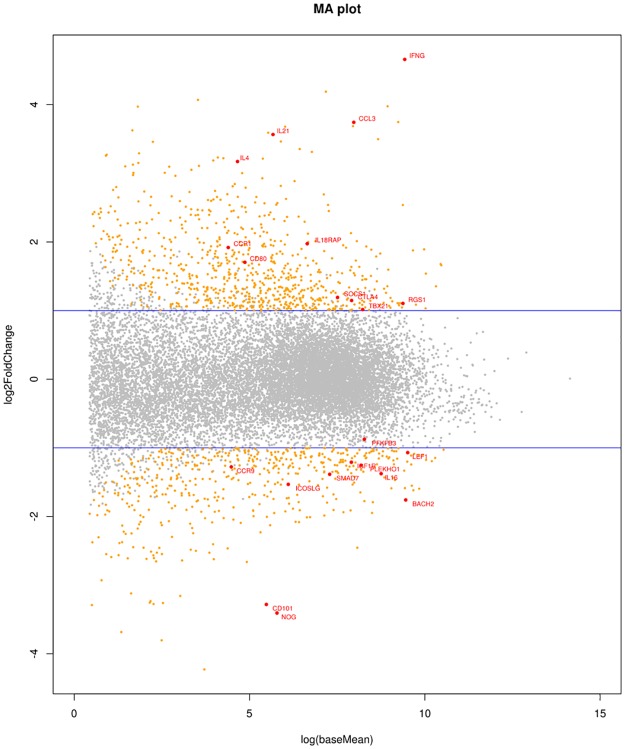
Fig 2. MA plot.
Scatter plot of fold-change in expression in cases versus controls (y-axis) against expression level (x-axis). 2 fold up or down regulated genes with adjusted P <0.05 are highlighted in yellow. Differentially expressed genes of interest are highlighted with red dots and labels. Horizontal blue lines indicate 2-fold changes in expression.

