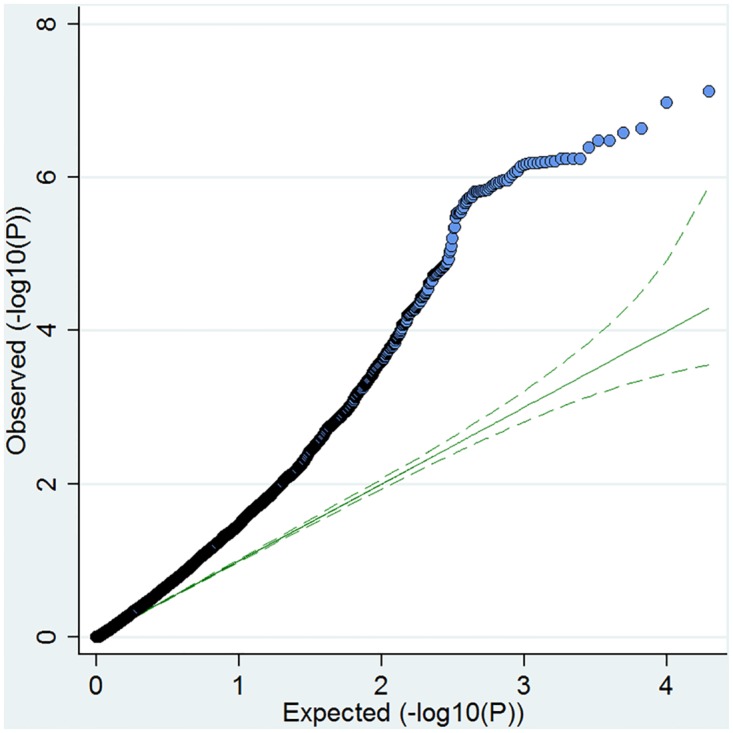
Fig 5. QQ plot of the Immunochip association signals within genes that were differentially expressed between our anti-CD3/CD28 stimulated coeliac and control samples.

The expected−log10 p values under the null hypothesis are represented on the x axis whilst the observed values are represented on the y axis.
