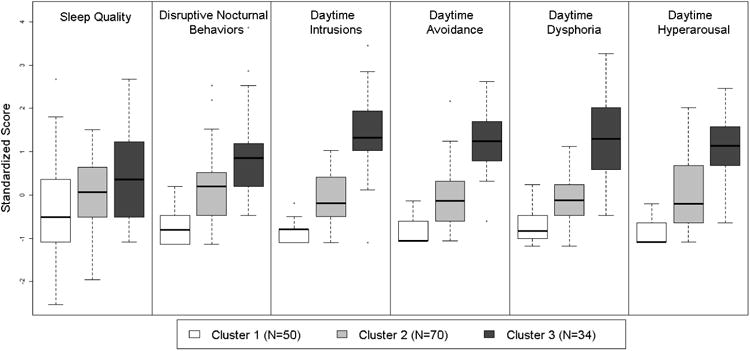
Figure 1.

Box-and-whisker plots of the standardized distributions of the six daytime and nighttime symptoms within each cluster. The box length indicates the interquartile range and the middle line indicates the median. “Whiskers” extending vertically from the box indicate the most extreme data point that is no more than 1.5 times the interquartile range from the box. Sleep quality and disruptive nocturnal behaviors (DNB) are measured with the Pittsburgh Sleep Quality Index (PSQI) and the PSQI-Addendum, respectively. Daytime symptoms are measured with the PTSD Checklist (PCL).
