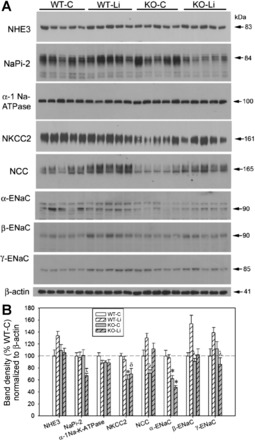
Fig. 4.

Effect of Li on the protein abundance of major renal Na+ transporters in the cortex (CTX) of WT and KO mice. Top: representative Western blots of cortex homogenates. Blots were loaded with equal amounts of protein per lane, and band densities were normalized by probing for β-actin on the lower portion of the membrane (n = 5 mice/treatment per genotype). A representative β-actin blot is also shown. NHE, Na+/H+ exchanger; NaPi-2, Na+-Pi cotransporter 2; NKCC2, Na+-K+-2Cl− cotransporter 2; NCC, Na+-Cl− cotransporter; ENaC, epithelial Na+ channel. Bottom: bar graph summary of densitometry (means ± SE). Symbols above the bars show the results of a multiple-comparisons test after significant (P < 0.05) one-way ANOVA. The following groups are shown: control WT (WT-C), Li-treated WT (WT-Li), control KO (KO-C), and Li-treated KO (KO-Li). *Significant difference from both WT-C and WT-Li groups (both WT groups); τsignificant difference from both WT-C and KO-C groups (both control treatments); δsignificant difference from the WT-C group only; λsignificant difference from the WT-Li group only.
