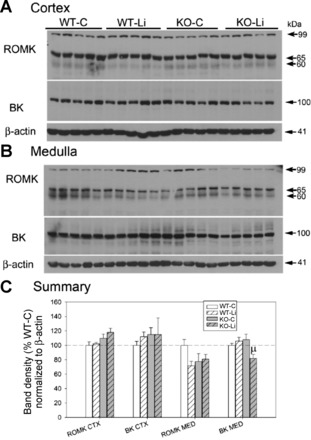
Fig. 6.

Effect of Li on the protein abundance of major renal K+ transporters in the cortex and medulla of WT and KO mice. A and B: representative Western blots of cortex (A) and medullary (B) homogenates. Blots were loaded with equal amounts of protein per lane, and band densities were normalized by probing for β-actin on the lower portion of the renal outer medullary K+ channel (ROMK) membrane (n = 5 mice/treatment per genotype). BK, large-conductance K+ channel. C: bar graph summary of densitometry (means ± SE). CTX, cortex; MED, medulla. The symbol above the bar shows the result of a multiple-comparisons test after significant (P < 0.05) one-way ANOVA. μSignificant difference from the WT-Li and KO-C groups.
