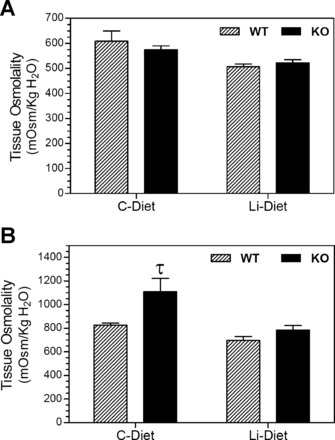
Fig. 7.

Effect of Li treatment on kidney tissue osmolalities in WT and KO mice. Groups of WT and KO mice were fed control (C) or Li-added diets for 14 days and euthanized (n = 6 mice/treatment per genotype). Inner stripes of outer medulla (A) and inner medullary (B) tissues were collected and processed as described in methods for the determination of tissue osmolalities. τSignificant difference from the corresponding WT group (P < 0.02 by an unpaired t-test).
