Fig. 3.

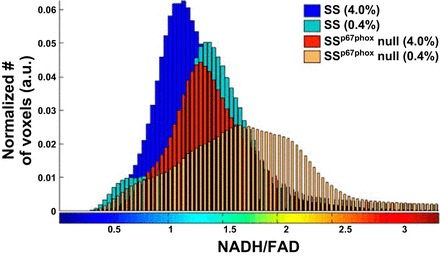
Intensity histogram distribution of the tissue redox ratio (NADH/FAD) for the four kidneys shown in Fig. 2. The mean value of each histogram was determined for each imaged kidney. a.u., Arbitrary units.

Intensity histogram distribution of the tissue redox ratio (NADH/FAD) for the four kidneys shown in Fig. 2. The mean value of each histogram was determined for each imaged kidney. a.u., Arbitrary units.