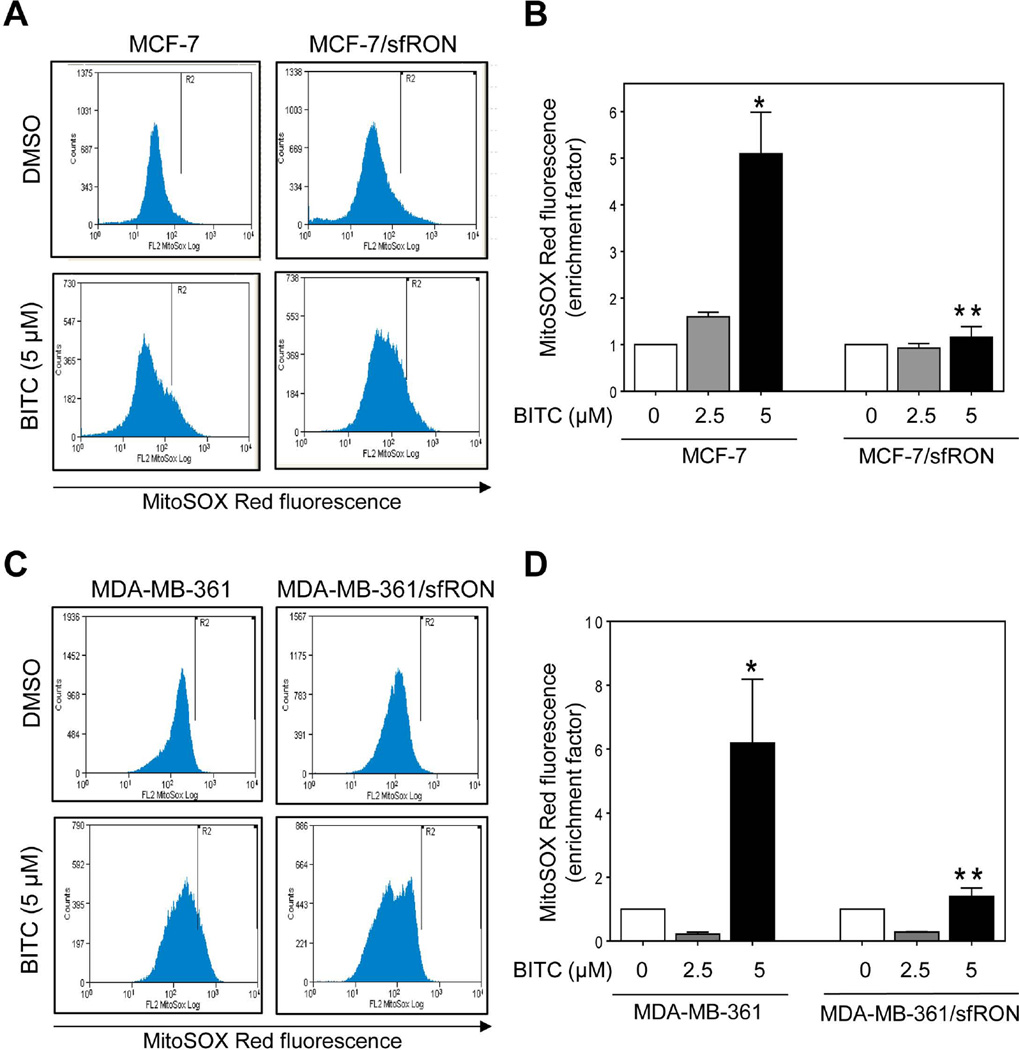
Fig 3.
Effect of sfRON overexpression on BITC-mediated ROS generation. Flow histograms showing MitoSOX Red fluorescence in (A) wild-type MCF-7 and MCF-7/sfRON cells and (C) wild-type MDA-MB-361 and MDA-MB-361/sfRON cells after 6 h treatment with DMSO or BITC. MitoSOX Red fluorescence enrichment relative to corresponding DMSO-treated control in (B) wild-type MCF-7 cells and MCF-7/sfRON cells and (D) wild-type MDA-MB-361 cells and MDA-MB-361/sfRON cells (mean ± S.D., n = 3). Significantly different (P < 0.05) compared with *respective DMSO-treated control and **between wild-type and sfRON overexpressing cells by one-way ANOVA followed by Bonferroni’s multiple comparison test. Results were consistent in replicate experiments.

