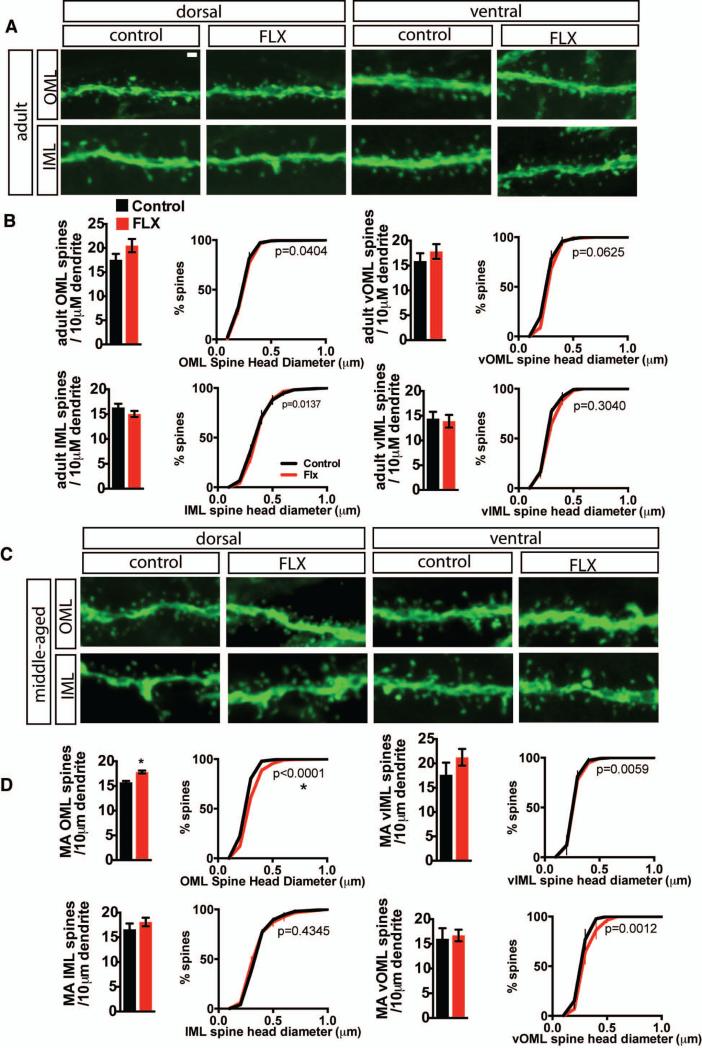
Figure 5. Fluoxetine treatment increases the density of spines in the outer molecular layer in middle-aged mice.
A Representative high magnification micrographs of dorsal and ventral inner molecular layer (IML) and outer molecular layer (OML) dendritic segments from control and fluoxetine-treated (18mg/kg/day for 28 days) adult thy1-GFP (M line) mice. B. Fluoxetine does not affect DG spine density or DG spine head diameter distribution for OML spines in dorsal (top left) and ventral (top right) DG or for IML in dorsal (bottom left) and ventral (bottom right) DG in adult mice. Data is expressed as mean (±SEM) number spines / 10 μM dendrite (bar graphs). Student's t-test, n=3, 5 (FLX) mice per group, dOML p=0.2009, vOML p=0.4344, dIML p=0.2354. vIML p=0.7953.) Data is expressed as the group mean percentage (±SEM) as a function of size (Komolgrov-Smirnoff test n=3 (VEH), 4 (FLX) mice, p values indicated on graphs with significance at p=0.0001). C. Representative high magnification micrographs of dorsal and ventral inner molecular layer (IML) and outer molecular layer (OML) dendritic segments from control and fluoxetine treated middle-aged thy1-GFP (M line) mice. D. In middle-aged mice, fluoxetine increases dorsal OML spine density and shifts dOML spine head diameter distribution toward larger spines. Density and distribution data presented as in B. Student's t-test, n=3 mice per group, dOML p=0.0038, vOML p=0.7923, dIML p=0.3665. vIML p=0.3010; * p<0.05. P values for Komolgrov-Smirnoff test as indicated on graphs. Significance at p≤0.0001; *). Scale bar 2μM.

