
Fig. 9.
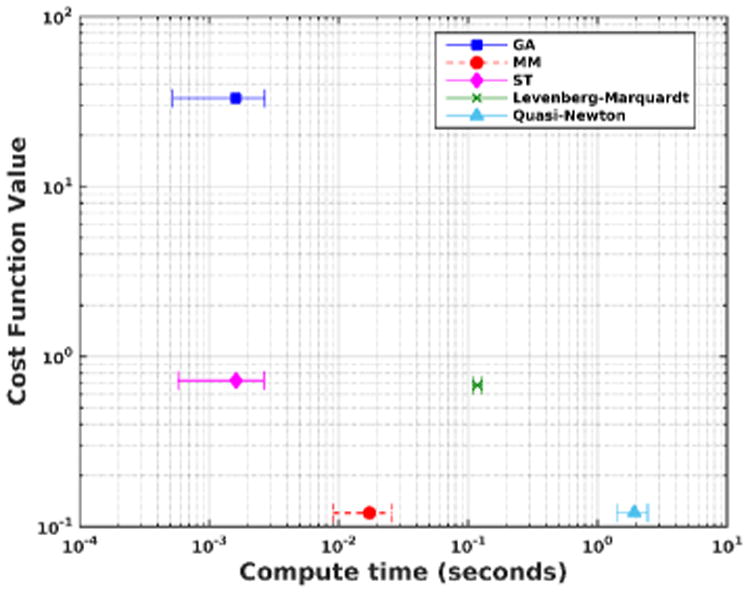
Plot of the cumulative PML cost function value for all voxels (normalized for easier visualization) versus the mean per-voxel compute time for different algorithms. The error bars show ± one standard deviation.
Official websites use .gov
A
.gov website belongs to an official
government organization in the United States.
Secure .gov websites use HTTPS
A lock (
) or https:// means you've safely
connected to the .gov website. Share sensitive
information only on official, secure websites.
Plot of the cumulative PML cost function value for all voxels (normalized for easier visualization) versus the mean per-voxel compute time for different algorithms. The error bars show ± one standard deviation.