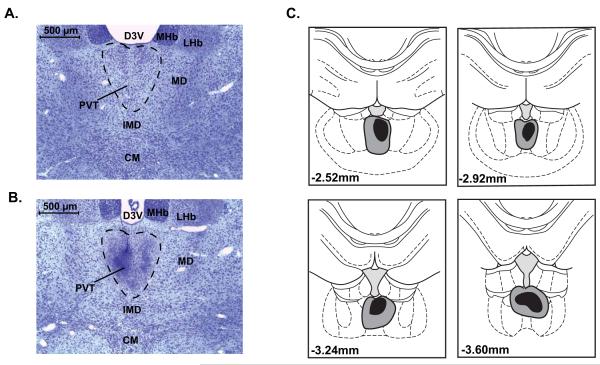
Figure 2.
Histological analysis of lesion sites for Experiment 1. Photomicrograph showing representative cresyl-violet stained sections of A) an intact PVT and B) a PVT lesion; approximate bregma level = AP −3.00, scale bar = 500 μm. C) Illustration showing the largest (gray) and smallest (black) accepted excitotoxic lesions of the PVT for Experiment 1.

