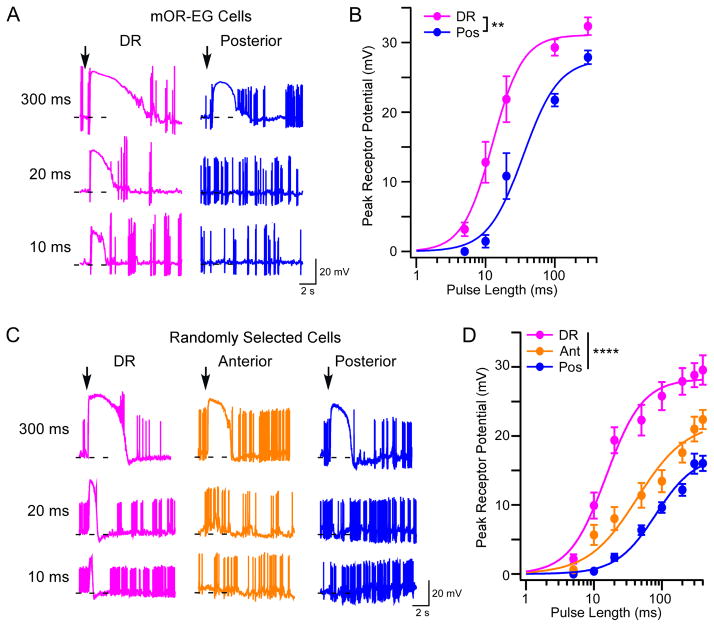
Figure 7. OSNs with Longer Cilia Are More Sensitive to Odorants.
(A) Representative traces from mOR-EG cells recorded alternately from the dorsal recess (n = 10 cells) and posterior (n = 9 cells) septum under current clamp mode. To stimulate cells with different eugenol concentrations, we delivered pressure pulses at different lengths (up to 400 ms) from a pipette containing 10 μM eugenol. Arrows mark the onset of the stimuli and dashed lines indicate −60 mV. (B) Summary of eugenol-induced responses (mean ± SE). Dose response curves are fit with the Hill equation. K1/2 is 12.7 and 35.0 ms for cells in the dorsal recess and posterior septum, respectively (two-way ANOVA, F = 3.2, ** p < 0.01). The dendritic knobs of mOR-EG cells in the anterior septum appeared smaller and slightly deeper from the surface, which made recordings from this region extremely difficult. In contrast, the dorsal recess has more cells to choose from and the posterior septum contains slightly bigger knobs. The anterior septum is included in randomly patched OSNs and in EOG recordings (see below). (C) Representative traces from randomly selected cells recorded from the dorsal recess (n = 28 cells), anterior (n = 31 cells), and posterior septum (n = 36 cells). We delivered pressure pulses as in (A) from a pipette containing a mixture of ten odorants (each at 10 μM). OR identity and ligand specificity were unknown since cells were arbitrarily chosen for recording. Therefore, approximately 50% of all recorded cells showed odorant-induced responses. (D) Summary of odor-induced responses from randomly selected cells. K1/2 is 15.1, 43.4, and 80.8 ms for cells in the dorsal recess, anterior and posterior septum, respectively (two-way ANOVA, F = 6.3, **** p < 0.0001). Randomly selected cells showed lower sensitivity than mOR-EG cells because some OSNs were only weakly stimulated by the odorant mixture. The difference in response sensitivity between anterior and posterior cells was further validated using EOG recordings (see also Figure S4).

