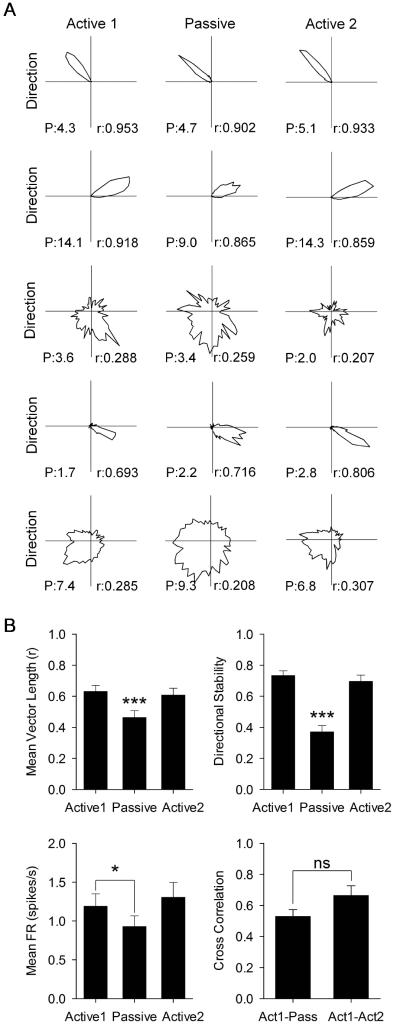
Fig. 3.
(A) Representative HD cell responses to Active 1, Passive, and Active 2 sessions. Columns are the same as in Fig. 1. Each row is a different cell’s polar plot of firing rate by direction. r = mean vector length. P = peak firing rate in spikes/s. (B) Data for mean vector length (top left), within-session directional stability (top right), mean firing rate (bottom left), and directional firing cross correlation (bottom right). Data are represented as mean ± SEM. Asterisks indicate difference from Active 1 and Active 2 unless otherwise indicated. * = p < 0.05; *** = p < 0.001.

