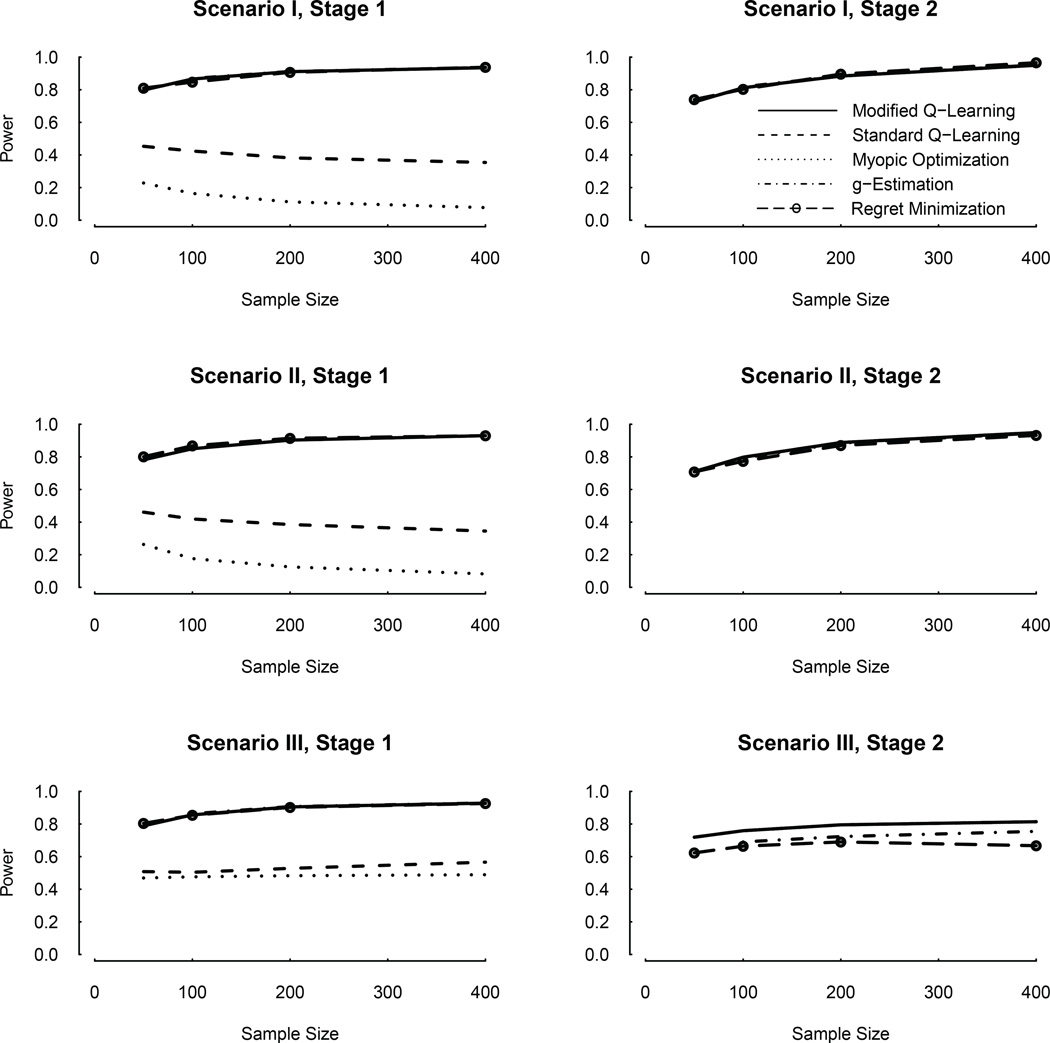
Figure 1.
Comparisons between the modified and standard Q-learning, myopic optimization, g-estimation and regret minimization: probability (power) of correctly identifying the optimal stage-1 and stage-2 treatments in Scenarios I, II, and III. Note: For stage-1, in all Scenarios, the power curves for the modified Q-learning, g-estimation and regret minimization almost overlap with each other. For stage-2, in all Scenarios, the power curves for the modified and standard Q-learning and myopic optimization overlap with each other, so that only the solid curve (modified Q-learning) is visible; they almost overlap with those for g-estimation and regret minimization in Scenarios I and II, and are higher than those for g-estimation and regret minimization in Scenarios III.

