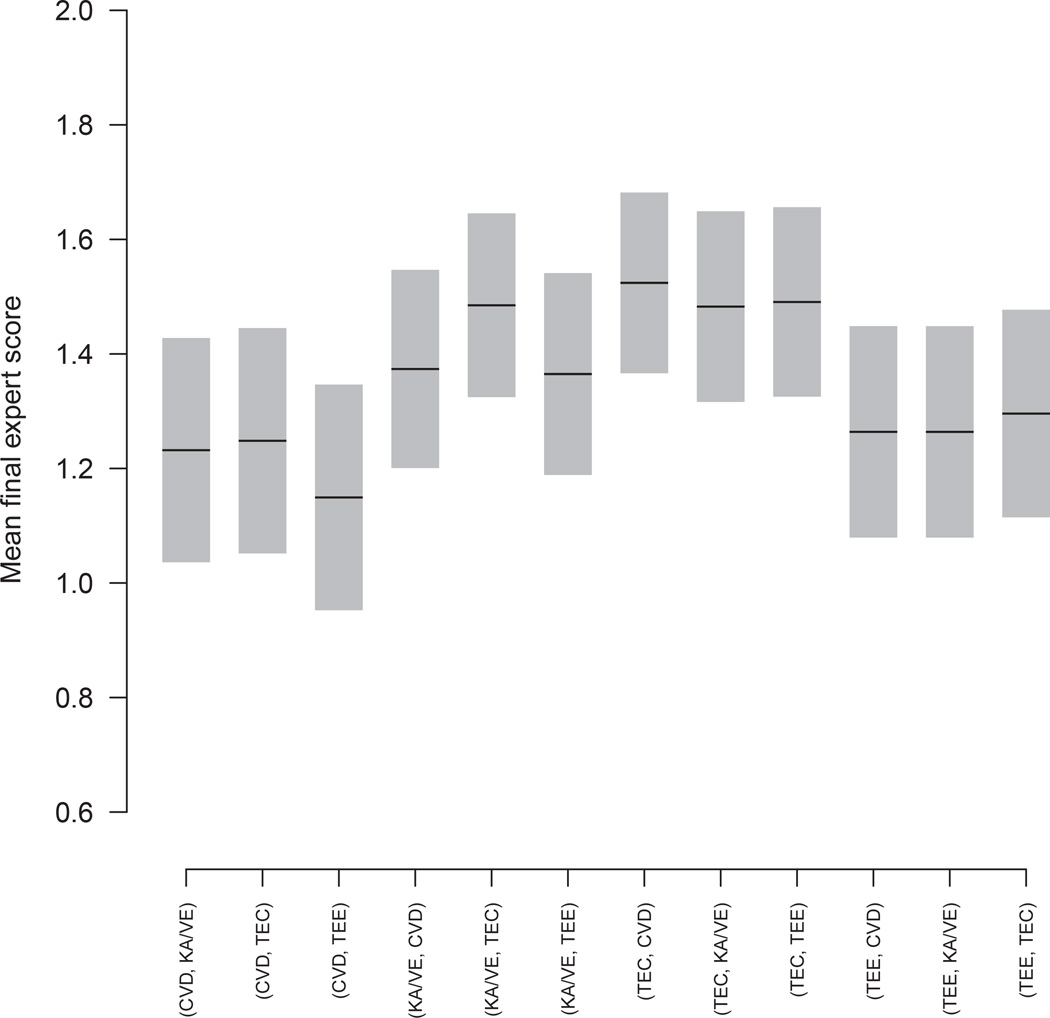
Figure 2.
Means and 90% confidence intervals of the final outcome (expert score) for the 12 treatment strategies in the form of (A, B), which means to start with treatment A, if success, stay with A; otherwise switch to treatment B, with A and B each takes one of the four values CVD, KA/VE, TEC and TEE, and A ≠ B.

