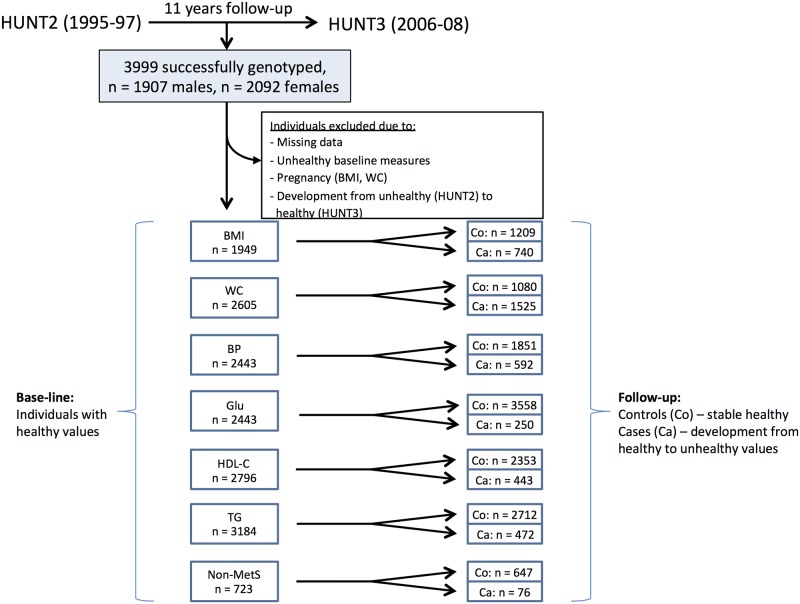
Fig 1. Flow diagram of individuals included in the adult longitudinal study.
Overweight/obesity was defined as having a BMI ≥ 25 kg/m2 or as ≥ 94 cm 102 cm (male) and ≥ 80 (female) with regards to waist circumference (WC). Unhealthy blood pressure (BP) was defined as systolic blood pressure ≥130 mmHg or diastolic blood pressure ≥ 85 mmHg, or antihypertensive drug treatment. Unhealthy blood glucose (GLU) level was defined as ≥7.0 mmol/l or use of or diabetes medical treatment and triglyceride (TG) level as ≥2.1 mmol/l (both cut-offs modified due to non-fasting measurements). An unhealthy HDL cholesterol (HDL-C) level was defined below <1.0 mmol/l (male) or <1.3 mmol/l (female). Metabolic syndrome (MetS) phenotype cut-offs were based on the original NCEP—ATP III definition taking into account WC, BP, GLU, HDL-C and TG levels. MetS-cases were those scoring below cut-off for all five measures at baseline, but above cut-off for at least three components at follow-up. Controls scored below cut-offs for all five measures both at base-line and at follow-up.

