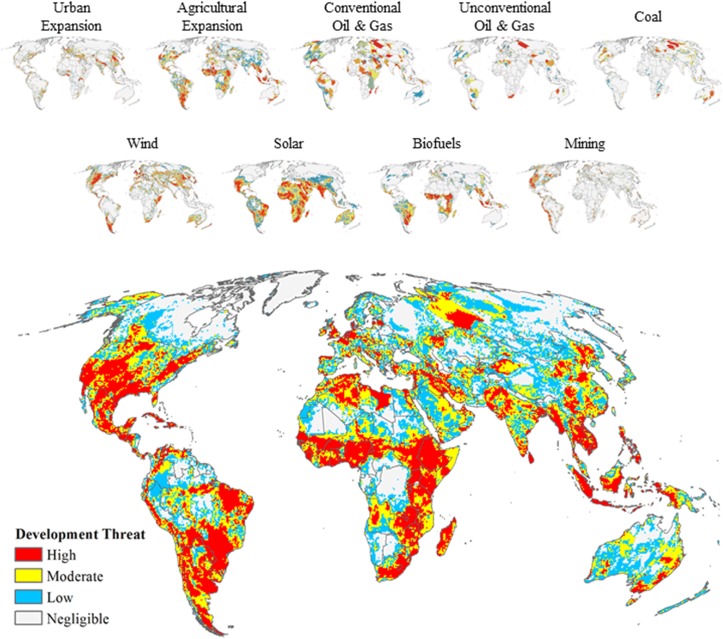
Fig 2. Future global development threat.
Individual sector development threat maps (top and also shown in Figs 5–13) used to calculate the cumulative future development threat (bottom) identified by binning global lands (except Antarctica) into four equal-area categories with the “High” category defined as the quarter of the globe with the highest cumulative threat scores.

