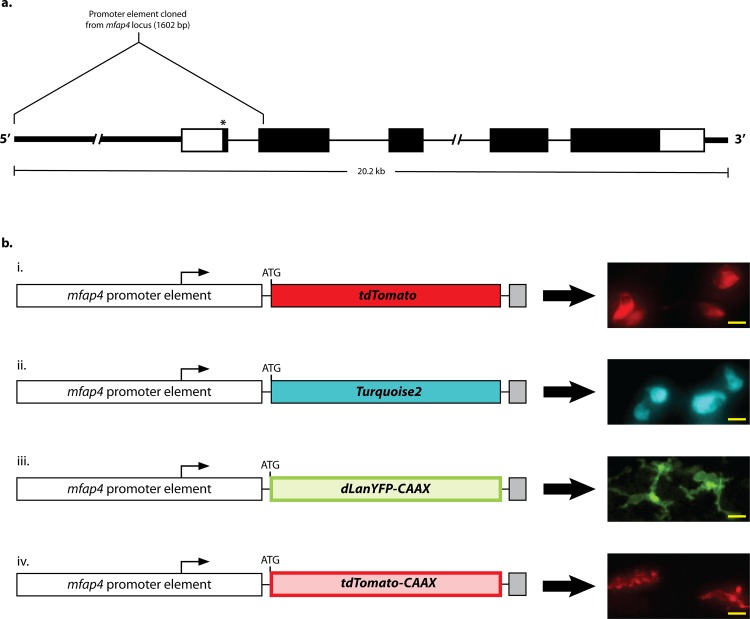
Fig 1. mfap4 transgene design.
a. Schematic of the mfap4 promoter sequence with respect to the full endogenous mfap4 locus. The full promoter element spans 1,602 bp. Thick lines represent genomic sequence flanking the 5’ and 3’ UTRs. Empty and solid boxes represent UTRs and coding regions, respectively. Thin lines represent introns. The asterisk denotes the location of the start codon mutation (ATG>ATT). b. Schematics of mfap4 transgenes and examples of their resulting expression. The bent arrows mark transcription start sites; “ATG” marks the beginning of the fluorescent protein ORF. White boxes depict the mfap4 promoter as the 5’ Element of an expression construct generated via the Gateway Recombination System; colored boxes depict Middle Elements containing fluorescent protein ORFs; grey boxes depict 3’ Elements containing a poly-adenylation signal. The lines connecting each element represent small linker sequences present as a result of the recombination process. i,ii. Expression of cytosolic tdTomato and Turquoise2 fluorescent proteins, respectively. iii,iv. Expression of membrane localized dLanYFP and tdTomato, respectively. The addition of the CAAX prenylation motif to the C-terminus of either fluorescent protein allows macrophage membrane projections to be easily visualized. Scale bars = 10 μm. Expression data representative of more than 50 animals for each construct.

