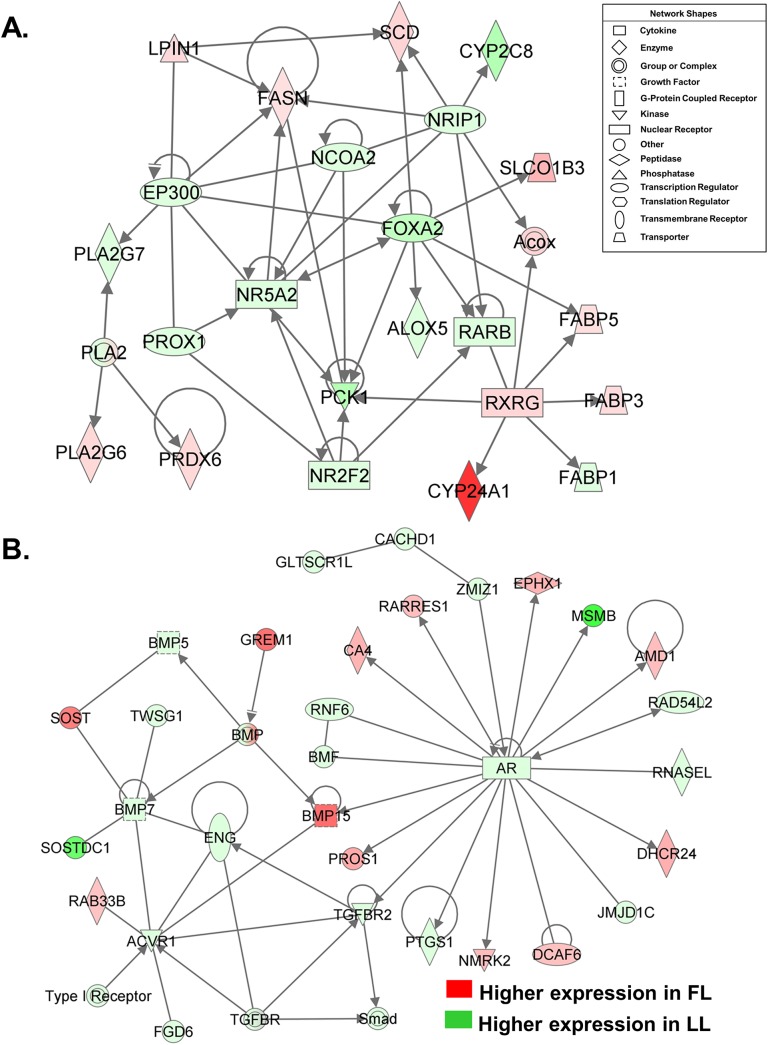
Fig 3. Gene interaction networks in abdominal fat of FL and LL chickens at 7 wk.
Functional gene networks were identified by IPA, DE genes are colored based on fold-change values (FL/LL) from RNA-Seq analysis. Each gene was assigned a shape by IPA according to its function as shown in the “Network Shapes” box. The top panel (A) shows a direct gene network annotated by IPA as “Lipid Metabolism, Small Molecule Biochemistry and Molecular Transport” that involves the interaction of several transcription factors, ligand-activated nuclear receptors, lipogenic enzymes and fatty acid transporters. The bottom direct gene interaction network (B) is centered on the androgen receptor (AR) and several direct targets of the AR including transforming growth factor, beta receptor II (TGFBR2 ) and bone morphogenetic protein 15 (BMP15).

