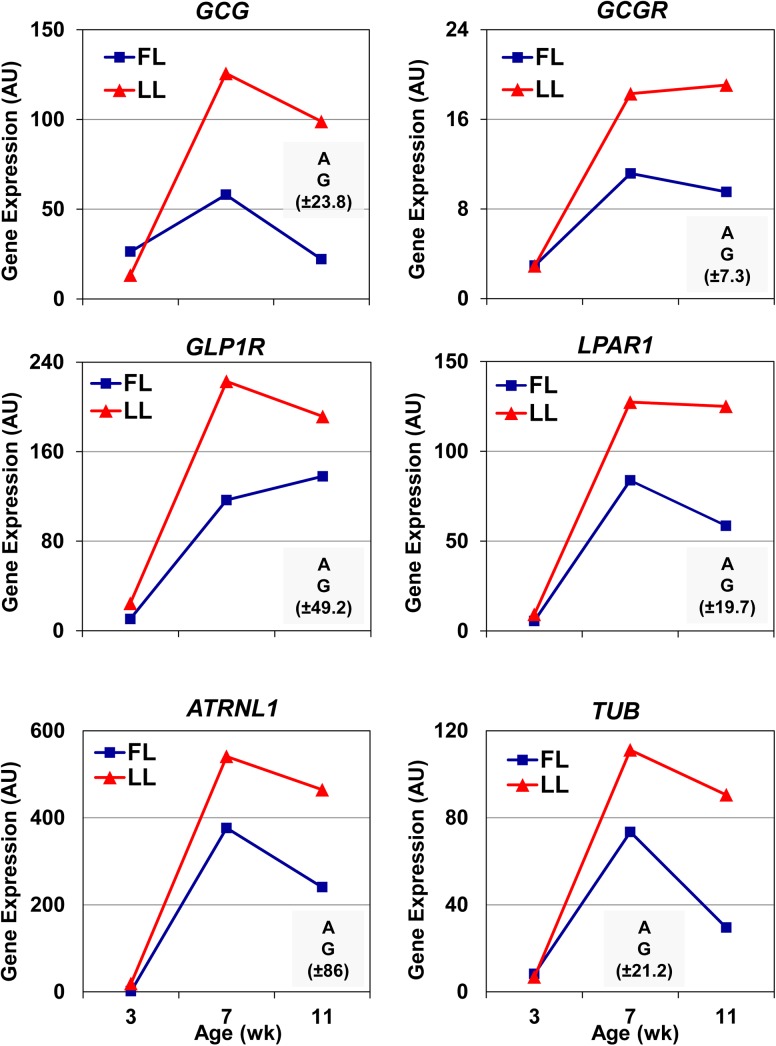
Fig 7. Quantitative RT-PCR analysis of select candidate genes in abdominal fat of FL and LL chickens.
Six genes were selected for qRT-PCR analysis of expression profiles in abdominal fat of FL and LL chickens at three ages (3, 7 and 9 weeks of age) to confirm highest expression at 7 wk. Data points represent Least Square Means (LSMEANS; n = 4 birds/genotype) of gene expression in arbitrary units (AU) based on the delta-delta cycle time (ΔΔCt) method. The general linear models (GLM) procedure in Statistical Analysis System (SAS) software (Cary, NC). A two-factor (genotype x age) analysis of variance (ANOVA) was used to determine significance (P≤0.05). The shaded box in each panel indicates significant main effects of genotype (G) or age (A); the number in parenthesis represents the common standard error (SE) of LSMEANS for that gene as determined by the GLM procedure in SAS. Gene symbols: attractin-like 1 (ATRNL1), glucagon (GCG), glucagon receptor (GCGR), glucagon-like peptide 1 receptor (GLP1R), lysophosphatidic acid receptor 1 (LPAR1), and tubby (TUB).

