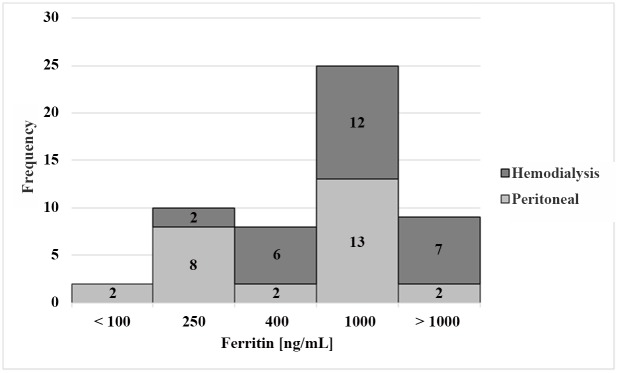
Fig 3. Histogram.

Distribution of ferritin concentrations in ng/mL of all patients (n = 54). Grey bars represent peritoneal dialysis patients (n = 27) and dark grey bars represent hemodialysis patients (n = 27).

Distribution of ferritin concentrations in ng/mL of all patients (n = 54). Grey bars represent peritoneal dialysis patients (n = 27) and dark grey bars represent hemodialysis patients (n = 27).