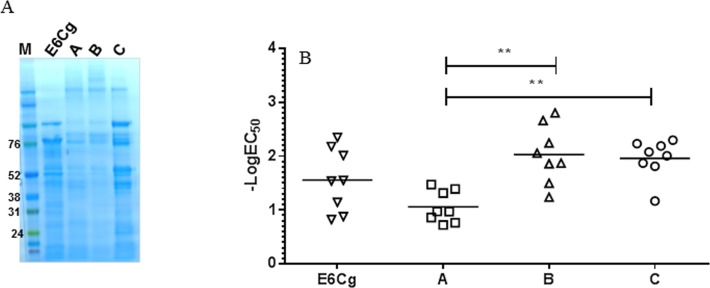
Fig 5. Comparison of GCr extracts from three different manufacturers.
(A) SDS-PAGE analysis of GCr extracts was performed under reducing conditions. (B) Overall mean log EC50 values are indicated on y-axis. Each point represents the signal from one scFv-coupled bead; horizontal bar is the mean value. **, p<0.05.

