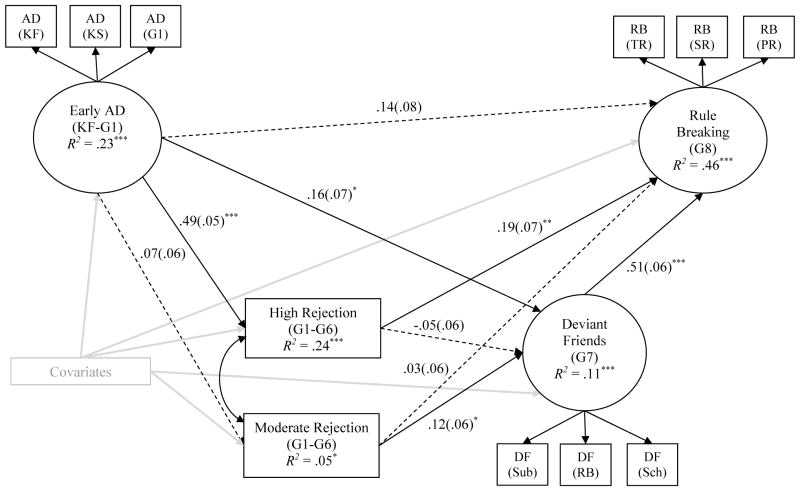
Figure 3.
Path diagram for the final model. Standardized path coefficients (and standard errors) for each path are shown above. Path estimates for the six covariates (i.e., socioeconomic status, family mobility, parental divorce, single parent household, maternal age, and verbal ability) are represented by the gray arrows but are not shown in this figure to simplify the presentation of results. Dashed lines represent estimated paths that were non-significant at p < .05. AD = aggression-disruptiveness; KF = kindergarten (fall); KS = kindergarten (spring); G = grade; RB = rule breaking; TR = teacher report; SR = self report; PR = parent report; DF = deviant friends; Sub = substance use; Sch = school conduct problems; *p ≤ .05; **p ≤ .01; ***p ≤ .001.

