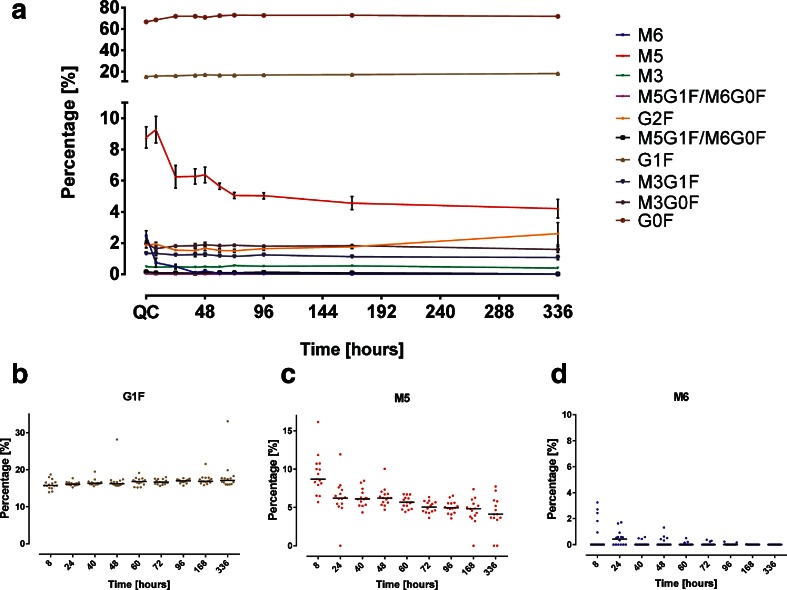
Fig. 7.
Glycan Maps of mAb1 for each time point. (a) Mean percentage and standard error of recovered mAb1 N-glycans after single subcutaneous administration in rabbits. The glycan map of the spiked QC samples is shown as reference. Dot plots showing the glycan percentages of individual rabbits for G1F (b), M5 (c) and M6 (d).

