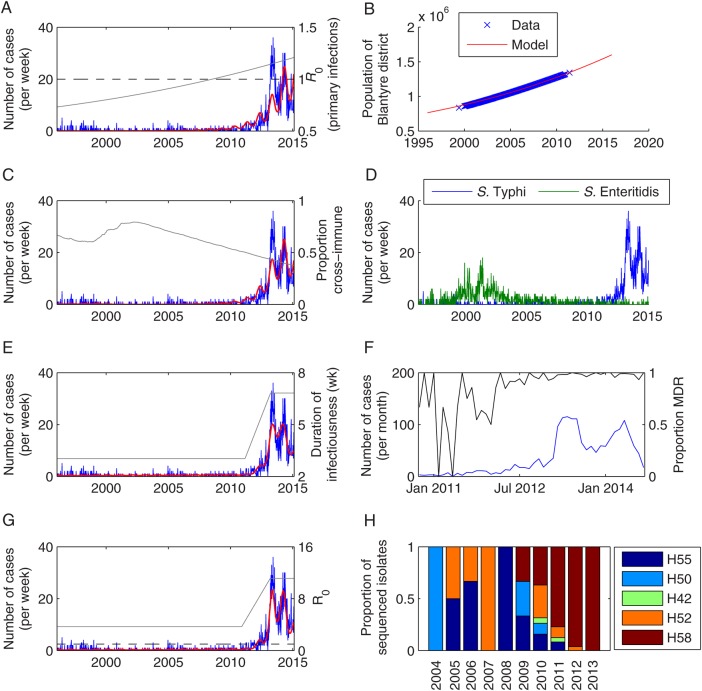
Figure 2.
Fit of models for scenarios 1–4 to data on weekly number of culture-confirmed Salmonella Typhi infections at Queen Elizabeth Central Hospital in Blantyre, Malawi, from January 1996 to February 2015. A, Observed weekly number of typhoid fever cases (blue) and best-fit model for scenario 1 (red). The R0 for primary infections is plotted in gray, while the dashed black line represents R0 = 1. B, Observed (blue) and modeled (red) population size of Blantyre district (in millions). C, Observed weekly number of typhoid fever cases (blue) and best-fit model for scenario 2 (red). The proportion of the population with cross-immunity from past Salmonella Enteritidis infection is plotted in gray. D, Observed weekly number of Salmonella Typhi (blue) and Salmonella Enteritidis (green) cases. E, Observed weekly number of typhoid fever cases (blue) and best-fit model for scenario 3 (red). The duration of infectiousness (in weeks) is plotted in gray. F, Observed monthly number of Salmonella Typhi cases (blue) and the proportion of isolates exhibiting multidrug resistance (MDR) (black) from October 2010 to December 2014. G, Observed weekly number of typhoid fever cases (blue) and best-fit model for scenario 4 (red). The overall R0 is plotted in gray. H, The proportion of sequenced Salmonella Typhi isolates belonging to each haplotype by year.

