Figure 6.

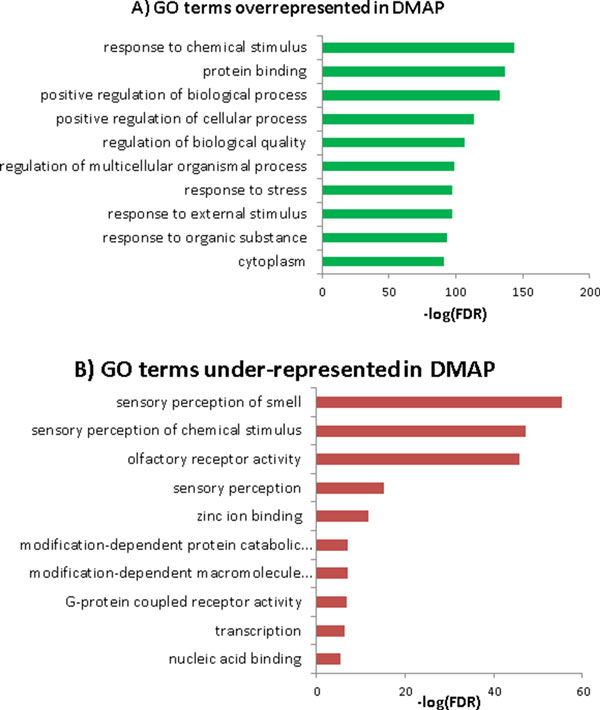
Top 10 gene ontology terms over-represented (A) and under-represented (B) covered by DMAP's proteins. The × axis is the -log(FDR) of gene ontology analysis acquired from DAVID functional annotation tool.

Top 10 gene ontology terms over-represented (A) and under-represented (B) covered by DMAP's proteins. The × axis is the -log(FDR) of gene ontology analysis acquired from DAVID functional annotation tool.