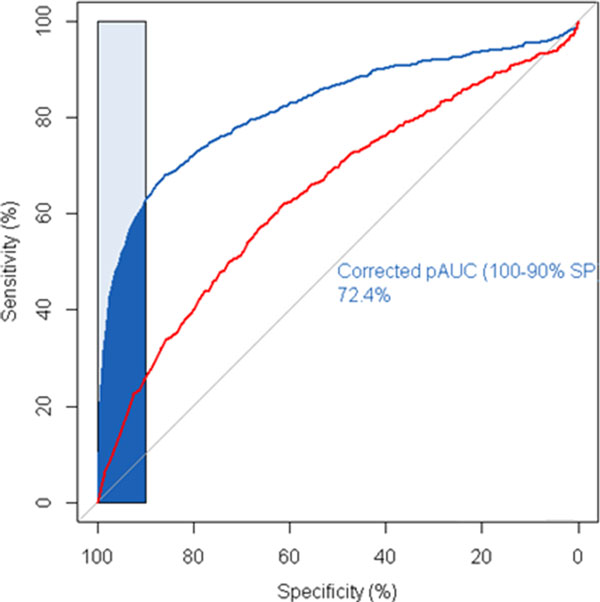
Figure 7.

ROC curves for the prediction performance based on DMAP (blue line) and CMAP (red line). Blue shade area provides a partial ROC area corresponding to specificity 90% above.

ROC curves for the prediction performance based on DMAP (blue line) and CMAP (red line). Blue shade area provides a partial ROC area corresponding to specificity 90% above.