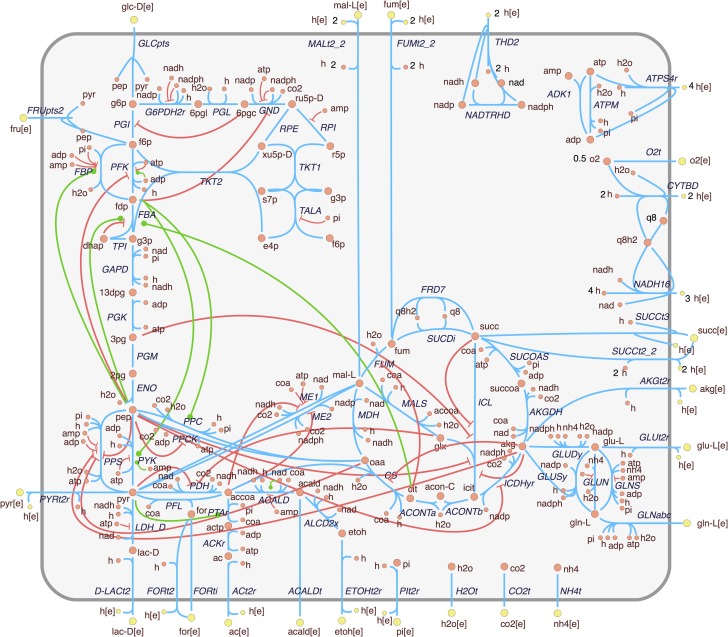
Figure 1.
Extension of the E. coli core metabolism model with allosteric interactions. Enzyme activations and inhibitions are represented, respectively, by green edges with circle ends and red edges with bar ends. This figure is adapted from the metabolic map available at the BiGG database (Schellenberger et al., 2010).

