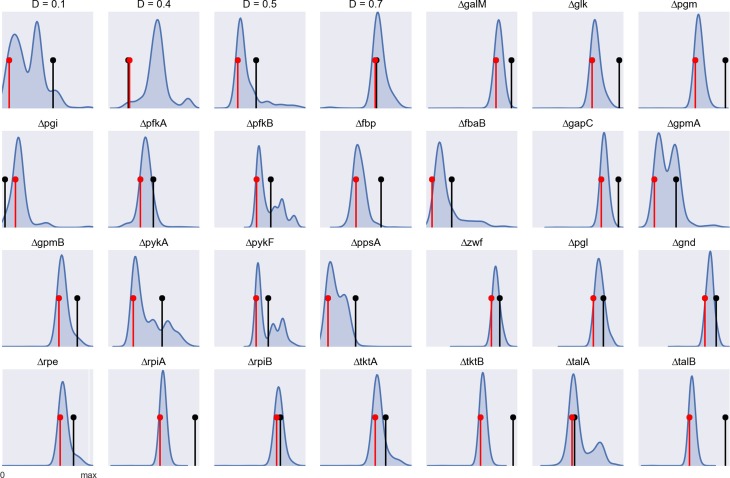
Figure 6.
Simulation accuracy determined by the (L1-norm) distance between experimental and simulated flux distributions for each experimental condition (data normalized by the maximum distance value). The blue curve shows the frequency distribution of the distances obtained by random sampling of the weighting factors in arFBA. The black pin marks the distance obtained with an FBA simulation. The red pin marks the distance obtained with arFBA after calibration of the weighting factors.

