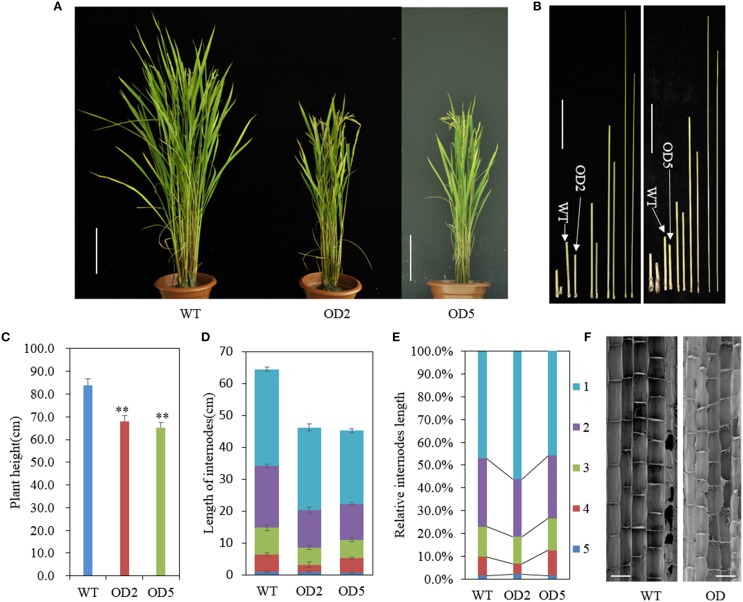
Figure 1.
OsDof12 overexpression plants showed dwarf phenotype. (A) Gross morphology comparison between wild type (WT) and OsDof12 overexpressing transgenic plants (OD) at maturity stage (approximately 120 days after sowing). The OD plants showed significantly reduced plant height and more compacted plant architecture than WT plants. Bar = 15 cm. (B) Comparison of the internode length. Left: WT vs. OD2; Right: WT vs. OD5. Bar = 5 cm. (C) Statistical analysis of plant height. Values are mean ± sd (n = 30). Double asterisks (**) stands for P < 0.01 determined by student's t-test. (D) Schematic representation of each individual internode length. Values are mean ± sd, n = 15. (E) The percentage of each internode length accounting for the total culm length. (F) Microscopic observation by SEM on the longitudinal section of the middle part in the second internode. Bar = 100μm.

