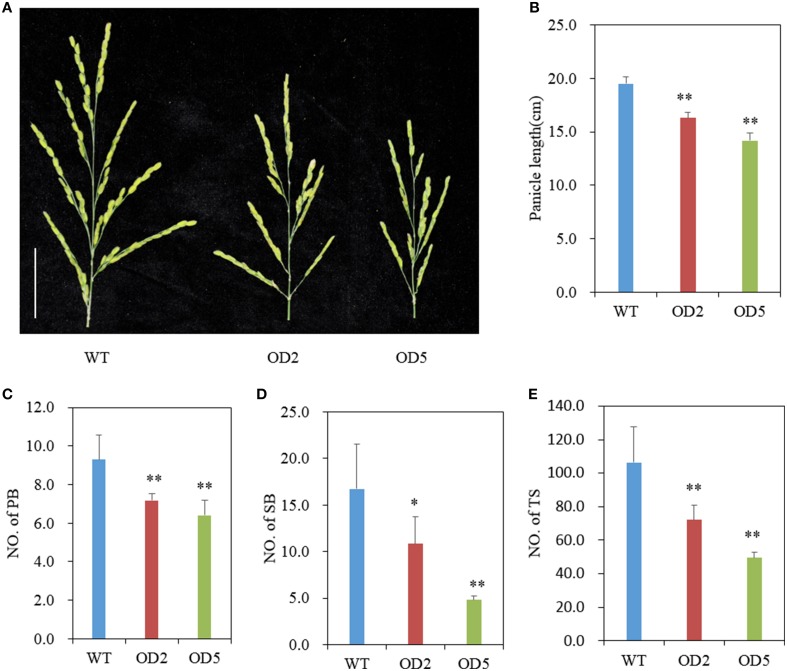
Figure 2.
Comparison of panicle structure. (A) Panicle morphology comparison between WT and OD plants. Bar = 5 cm. (B-E) Statistical results of panicle length (B), number of primary branches (C), secondary branches (D), and total spikelets per panicle (E) in WT and OsDof12 overexpression plants. PB, primary branches; SB, secondary branches; TS, total spikelets. Values are mean ± sd (n = 30). Single asterisk (*) and double asterisks (**) stand for P < 0.05 and P < 0.01, respectively, determined by student's t-test.

