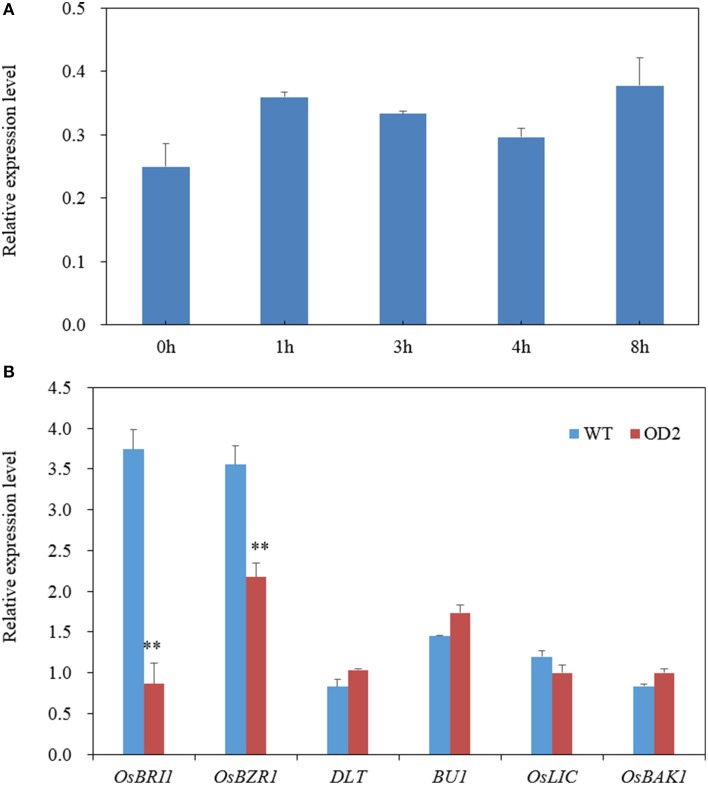
Figure 7.
Gene expression analysis. (A) OsDof12 induction analysis. Two-week-old WT seedlings were subjected to exogenous 100 nM BL treatment, then whole plants were collected at different time point for gene expression analysis. (B) qRT-PCR analysis of BR signaling genes. Seven-day-old seedlings grown on half-strength MS were used for expression analysis. Values are mean ± sd, n = 3. Double asterisks stand for P < 0.01 determined by student's t-test.

