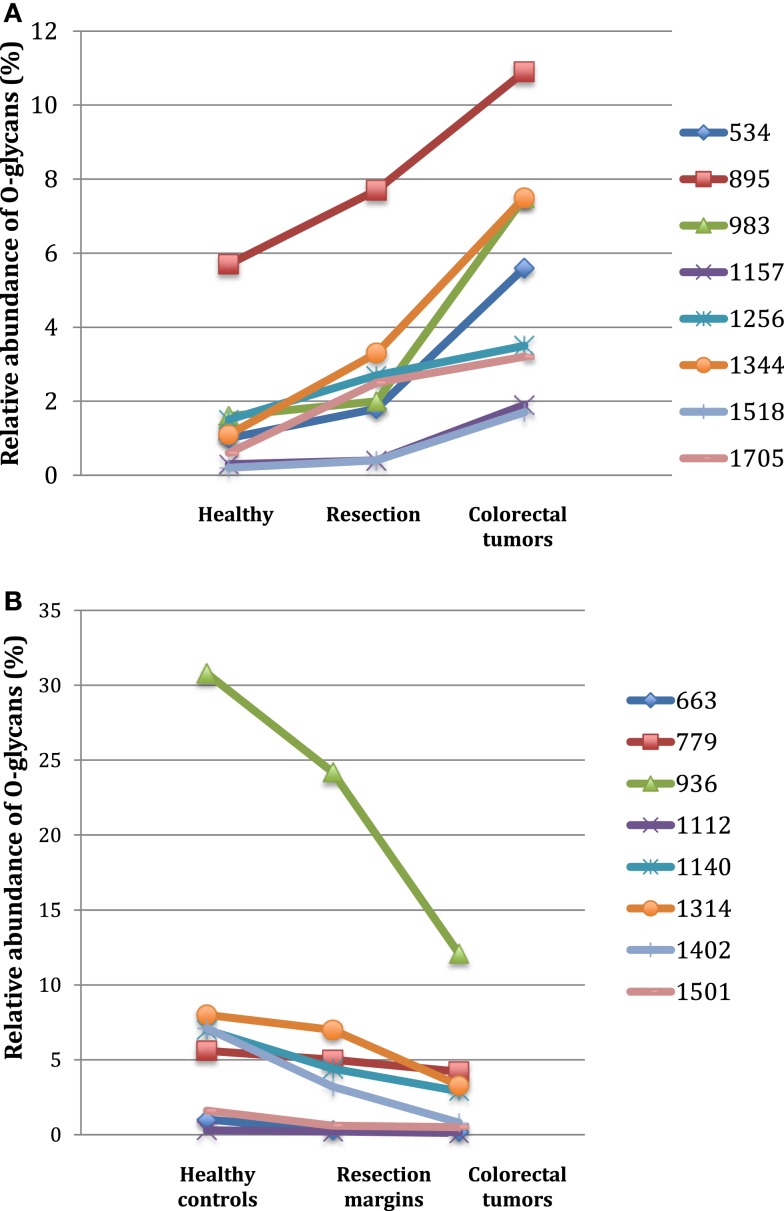
Figure 2.
Gradients in the level of expression of mucin O-glycans from healthy controls colonic tissues (n = 5) to resection margins (n = 10) and paired tumors of patients (n = 10) with colorectal cancers. The mean is represented for all measurements. (A) CRC-specific increase in the level of expression of O-glycans corresponding to ions at m/z 534, 895, 983, 1,157, 1,256, 1,344, 1,518, and 1,705. (B) CRC-specific decrease in the level of expression of O-glycans corresponding to ions at m/z 663, 779, 936, 1,112, 1,140, 1,314, and 1,402.

