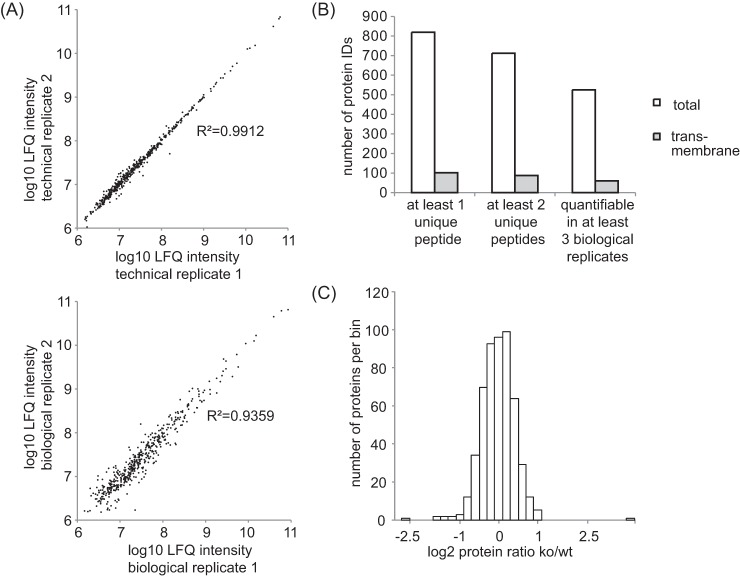
Fig. 3.
Quality control of the label-free comparative CSF analysis of BACE1−/− mice. A, Upper panel: The log10 LFQ intensities of two selected technical replicates are plotted against each other. Lower panel: The log10 LFQ intensities of two selected biological replicates (two individual BACE1−/− mice) are plotted against each other. Note the high correlation for both biological and technical replicates as indicated by the coefficient of determination being close to 1. B, Number of identified proteins that were detected by at least 1 unique peptide, at least 2 unique peptides and at least 2 unique peptides that were quantifiable in 3 or more biological replicates. LFQ: label-free quantification. ID: protein identification. C, Histogram displaying the relative protein abundances in the BACE1−/− CSF. The log2 fold change of the mean BACE1−/− : wild-type ratio is shown on the x axis. The bin size for the log2 fold change is 0.2. The vast majority of all quantified proteins remained unchanged. Ko: BACE1−/−. Wt: wild type.

