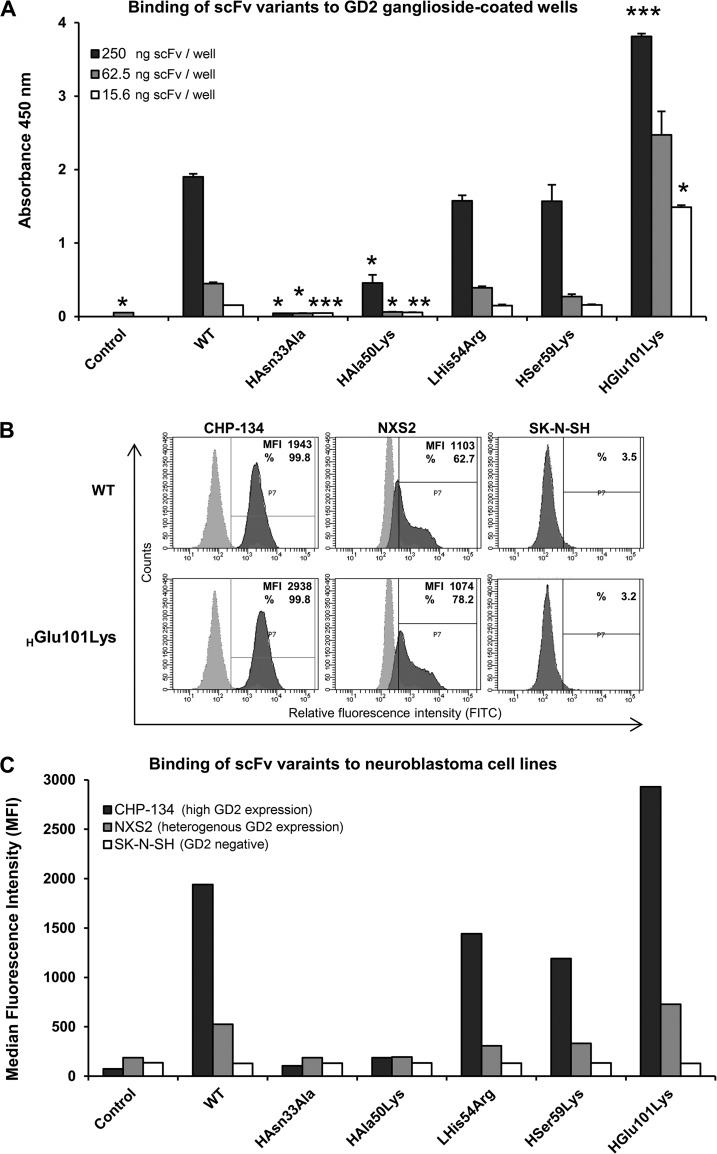
Fig. 4.
Relative affinity and specificity of scFv variants toward GD2. (A) Binding of scFv variants to GD2 as evaluated by ELISA. Plastic surface was coated with GD2 and incubated with particular scFv, which binding was detected using HRP-conjugated anti-His tag antibody; WT - wild type scFv, Control - signal from wells incubated with anti-His tag antibody alone. The statistical significance in ELISA signals between the wild type scFv-14G2a and its mutants was evaluated by t test (p values are indicated as follows p < 0.05 (*), p < 0.01 (**) and p < 0.001 (***). (B, C) Binding of scFv variants to GD2 on the cell surface. CHP-134 (high GD2 expression), NXS2 (heteregenous expression of GD2) and SK-NS-H (GD2-negative) neuroblastoma cell lines were first incubated with evaluated scFv variants and then with FITC-labeled anti-His tag antibody. Staining was measured by flow cytometry. (B) Representative histograms showing binding of WT and HGlu101Lys variants of scFv (5 μg/ml) to tested neuroblastoma cells (dark gray) overlaid with control staining of the respective cells with FITC-conjugated anti-His tag antibody alone (light gray). Based on signals from cells stained with the latter antibody alone, positive cell pools were determined (gate P7) for which median fluorescence intensity (MFI) and/or percentage of staining (%) values were measured (as indicated on the plots). (C) MFI signals for single cell populations stained with particular scFv and FITC-conjugated anti-His tag antibody, or the latter antibody alone (control).

