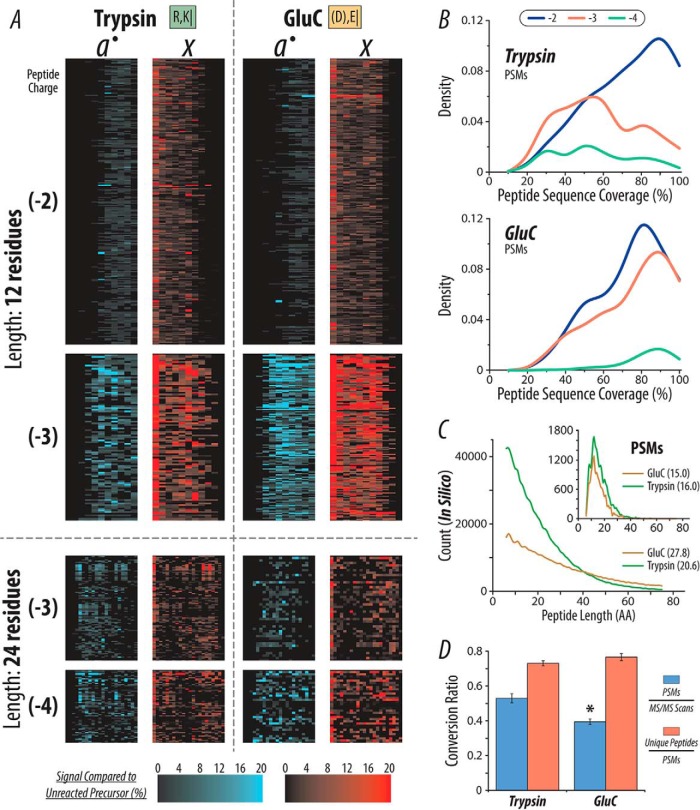
Fig. 6.
Comparison of single-shot AI-NETD for peptides produced by either trypsin or GluC. (A) AI-NETD fragment map for peptides (12 and 24 amino acids in length) derived from both trypsin and GluC digestions. The numbers in parenthesis to the left indicate peptide charge. (B) Density plots for peptide sequence coverage for PSMs from trypsin and GluC. (C) The larger histogram shows the distribution of peptide lengths from an in silico digest for trypsin and GluC. The inset displays the distribution of lengths of peptides identified in the trypsin and GluC experiments. The numbers in parenthesis in the respective legends show the average peptide length for each protease. (D) The MS/MS success rate (blue) for GluC peptides is significantly lower than tryptic peptides (p < .01, indicated by *), while the ratio of unique peptides to total PSMs detected (red) is not statistically different (p < .05).

