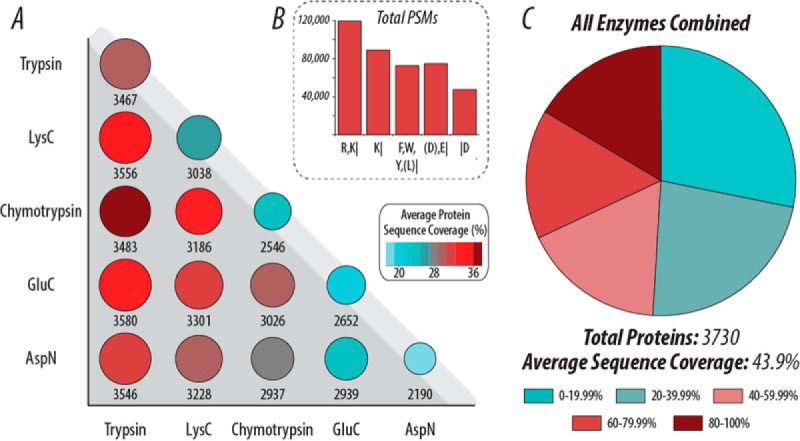
Fig. 7.

Proteome coverage in the negative mode with various proteases using AI-NETD and low-pH fractionation. (A) Pairwise comparisons of the number of proteins (area of circle) and average protein sequence coverage (color) when using different proteases, illustrating the degree of orthogonality of each protease with the others. The circles along the top edge (light gray background) show each enzyme by itself. (B) The total number of PSMs for each protease. (C) When combining all PSMs from the five enzymes, AI-NETD characterizes over 80% of the yeast proteome (, proteins). The pie chart here shows what proportions of these proteins had sequence coverage in the given range.
