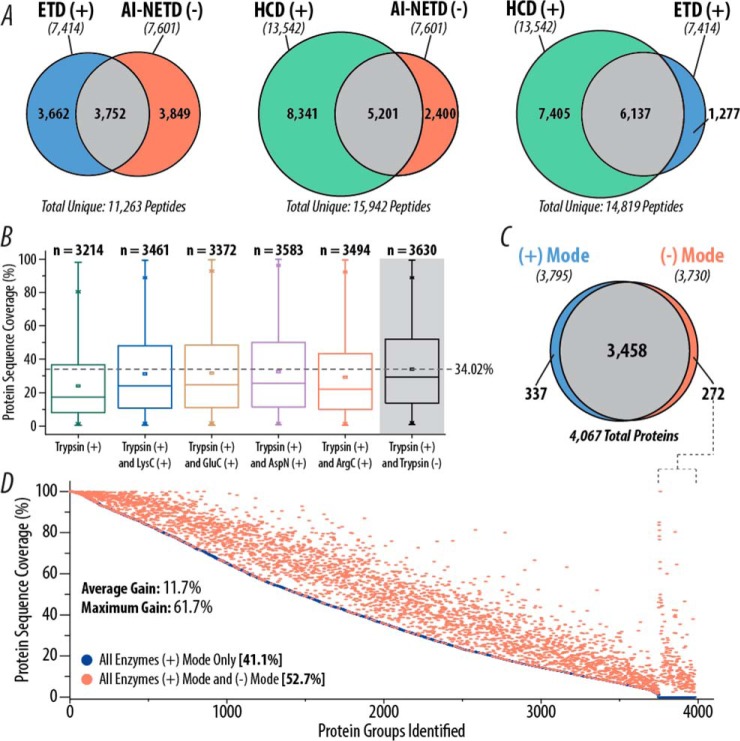
Fig. 8.
Comparison of AI-NETD to positive mode analyses. (A) Overlap in yeast tryptic peptides identified in HCD, ETD, and AI-NETD single-shot experiments. The number of unique peptides identified with each fragmentation type are indicated in italics below the appropriate label. (B) Distribution of protein sequence coverages achieved with combinations of trypsin with different proteases in positive mode analyses with CID and ETD fragmentation compared with positive mode data combined with negative mode data with AI-NETD (gray background) using only trypsin. The dotted line shows the highest average sequence coverage. (C) Overlap in yeast proteins identified using positive mode (CID and ETD) and negative mode (AI-NETD) analyses. For both sets of proteins, peptides from five different proteases were batched together. (D) Proteins detected in the positive mode data from (C) are rank ordered by percentage sequence coverage and plotted in blue, with an average sequence coverage of 41.1%. The protein sequence coverage achieved for a given protein when combining the positive and negative mode data is plotted in red, highlighting the gain in sequence coverage afforded by the addition of negative mode analyses. To the far right, sequence coverages are shown for the 272 proteins that were not detected in positive mode analyses but were characterized with AI-NETD.

