Fig. 2.
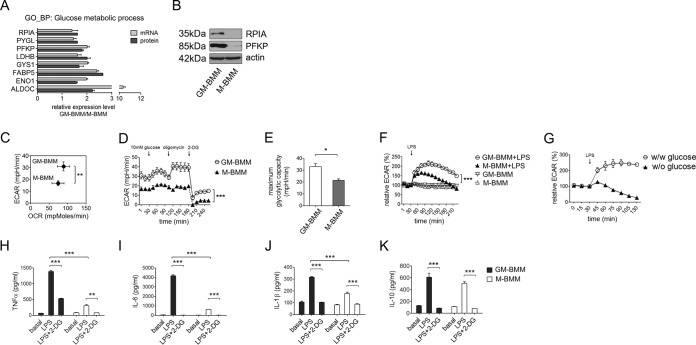
GM-BMMs have higher glycolytic capacities than M-BMMs. A, Expression profiles of glycolytic genes and proteins in GM-BMMs compared with M-BMMs. ***, p < 0.001 by two-way ANOVA. B, Western blot results for RPIA, PFKP, and actin. C, Basal OCR and ECAR of GM-BMMs and M-BMMs. Data obtained using XF-24 extracellular flux analyzer. Three independent experiments were performed. **, p < 0.01 by Student t test. D, Maximum glycolytic capacities of GM-BMMs and M-BMMs. Perturbation profiling of lactate production (ECAR) was achieved by the addition of glucose (10 mm), oligomycin (5 μm), and 2-deoxyglucose (2-DG, 100 mm). Three independent experiments were performed. ***, p < 0.001 by two-way ANOVA. E, Quantitative graph representing mean maximum glycolytic capacities of GM-BMMs and M-BMMs. Three independent experiments were performed. *, p < 0.05 by Student t test. F, LPS induced acute glycolysis. GM-BMMs and M-BMMs were stimulated with 100 ng/ml E. coli LPS and recorded for the ECAR changes. Data showing relative ECAR (%) changes from baseline. Three independent experiments were performed. ***, p < 0.001 by two-way ANOVA. G, Glucose effect on acute glycolysis upon LPS stimulation. GM-BMMs were stimulated with LPS with or without media glucose and ECAR changes were recorded. H–K, GM-BMMs produced more inflammatory cytokines than M-BMMs in a glycolysis-dependent manner. GM-BMMs and M-BMMs were sorted and replated in 96-well plates at 5 × 10⁵ density. Cells were treated with LPS (100 ng/ml) with or without 2-DG (100 mm) and cytokines were measured at 4 h (TNFα) and 24 h (IL-6, IL-1β, IL-10). ELISA was performed to quantify TNFα (H), IL-6 (I), IL-10 (K) production in culture supernatants, or IL-1β synthesis (J) in cell lysates. Three independent experiments were performed. **, p < 0.01, ***, p < 0.001 by two-way ANOVA.

