Fig. 3.
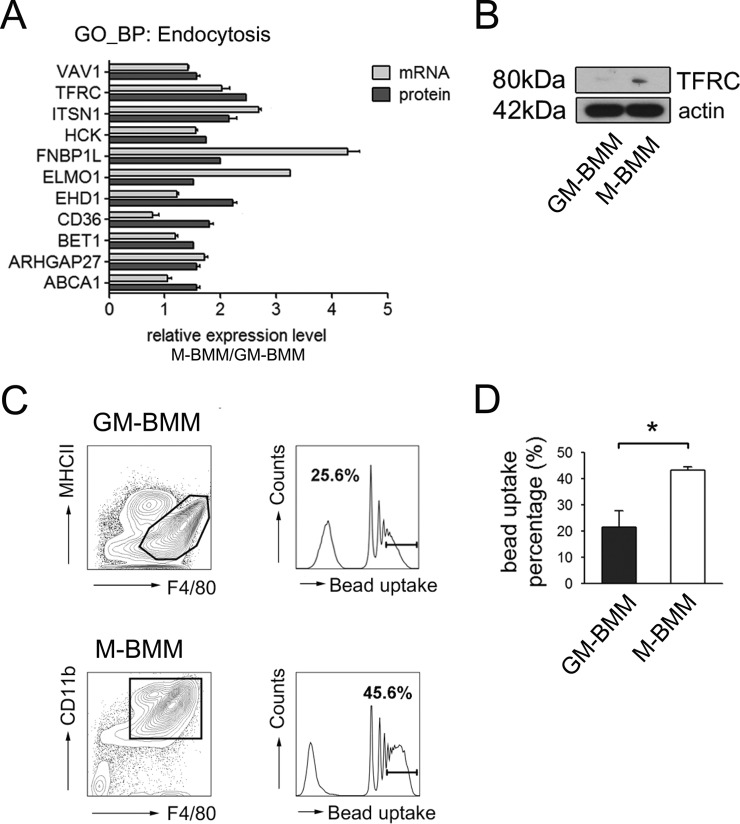
M-BMMs phagocytosed more beads than GM-BMMs. A, Relative mRNA and protein expression levels of endocytosis participants in M-BMMs compared with GM-BMMs. **, p < 0.01, ***, p < 0.001 by two-way ANOVA. B, Western blot results for TFRC and actin. C, Histograms showing the number of beads per cell. Sorted macrophages were replated and incubated with Alexa350 tagged latex beads for 2 h. Bead phagocytosis was analyzed per macrophage population (GM-BMMs: F4/80+MHCII+, M-BMMs: F4/80+CD11b+) using FACS. Cell percentages containing more than four beads are indicated in both histograms. D, Quantitative graph showing cell percentages with more than four beads per cells. Three independent experiments were performed. *, p < 0.05 by Student t test.

