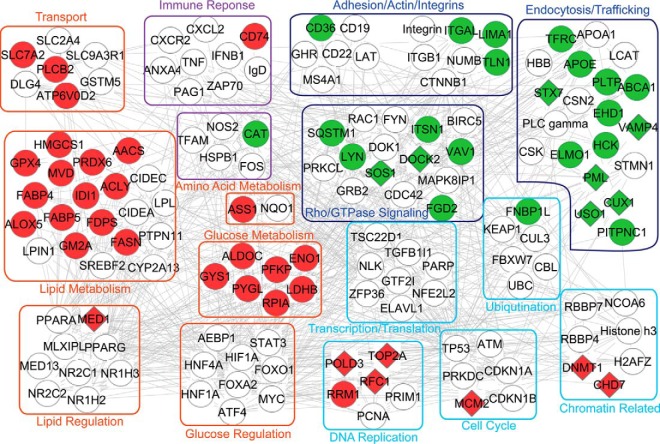
Fig. 4.
Regulated protein networks in GM-BMMs versus M-BMMs. Protein abundance and phosphorylation data were analyzed with the Ingenuity Pathway Analysis (IPA) using 145 differentially expressed proteins and phosphoproteins involved in differentially regulated biological process between GM-BMMs and M-BMMs. Glucose metabolism, lipid metabolism, amino acid metabolism, DNA replication, endocytosis, and Rho/GTPase signaling were the subnetworks most significantly affected. Proteins/nodes are grouped according to their function. Red color indicates GM-BMMs up-regulation and green is M-BMMs up-regulation. Circle means DEP, diamond means DPP. White circles are predicted interacting signaling molecules as well as transcription factors. All indicated by gene symbol.

