
Fig. 6.
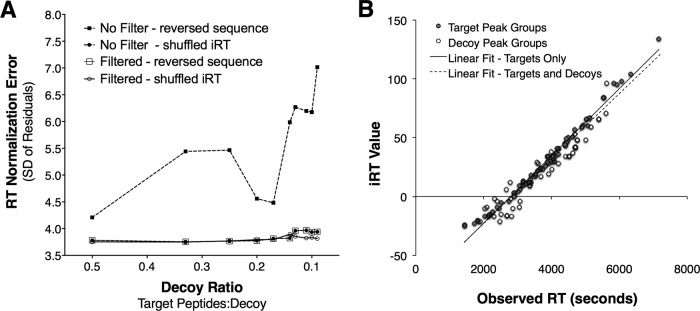
Robustness of the computed linear alignment in the presence of noise signal when using a jackknife approach for outlier removal. A, Increasing the number of noise signals from 2× to 10× impacts the error of the linear model (measured as standard deviation of the residuals of the correct signals) only substantially if peak quality is not taken into account. If a peak quality threshold is used and low-quality peaks are discarded (open symbols), the error of the linear model is almost constant even if a large number of false signals are present. B, Example robust regression in the presence of a 10-fold excess of noise peaks using the jackknife approach to remove outlier signal. In red are all known correct datapoints and in black are noise datapoints that by chance correlate with the correct ones and thus pull through the filtering. The dashed black regression line was obtained from all shown datapoints (R2 = 0.95), the solid black regression line was the regression model obtained from only the known correct datapoints (R2 = 0.98). The measured error of the linear model is 3.86 (whereas the error when only using the known correct datapoints is 3.76) and while achieving an accuracy of 94.9%.