
Figure 3.
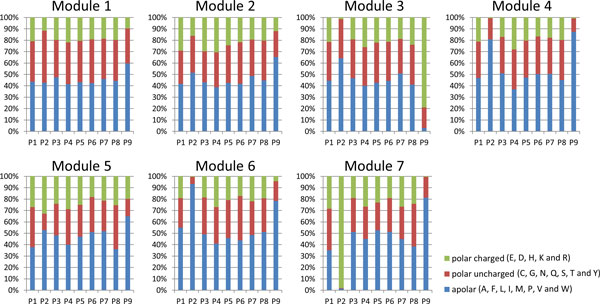
The distribution of amino acid residues by position from 9-mer peptides in each module. Each bar chart shows the 9-mer peptides from a module indicated at the top of the bar chart. The x-axis marks P1 to P9 represent positions 1 to 9 in 9-mers. At each position, 20 possible amino acid residues were categoried into three groups: polar charged (green), polar uncharged (red) and apolar (blue). The percentages of the three groups are shown at each position.