
Figure S5.
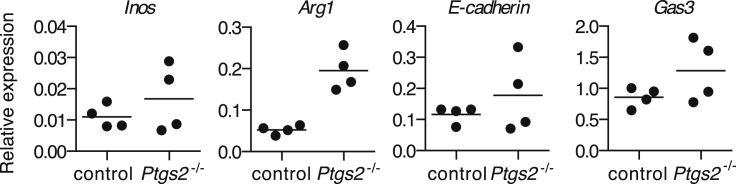
Expression of Markers Associated with M2 Polarization in Tumors Formed by Ptgs2−/− Cells, Related to Figure 2
WT mice were inoculated with control or Ptgs2−/− BrafV600E cells and four days later the expression of Inos, Arg1, E-cadherin and Gas3 mRNA was determined by qPCR in whole tumor homogenates. Relative expression of each gene was normalized to hprt. Each dot represents one independent tumor.