Figure 2.
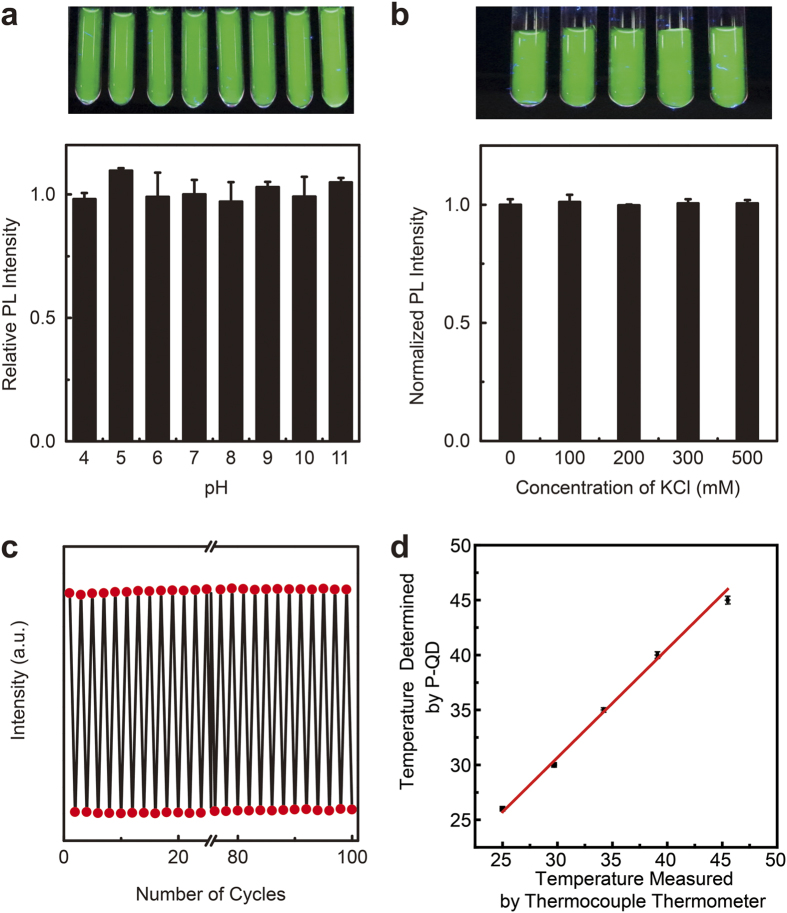
(a) Top: Photograph of P-QD in solutions with various pH, under 365 nm light. Bottom: The PL intensity as a function of pH. Error bars represent standard deviations obtained from three parallel experiments. (b) Top: Photograph of P-QD in solutions with different KCl, under 365 nm light. Bottom: The PL intensity as a function of the concentration of KCl. Error bars represent standard deviations obtained from three parallel experiments. (c) The PL intensity of P-QD under 25 °C (top panel) and 37 °C (bottom panel). The heating-cooling cycles were repeated 100 times. (d) The temperature determined by P-QD temperature probes and the values measured with a thermocouple thermometer. Error bars represent standard deviations obtained from three parallel experiments.

