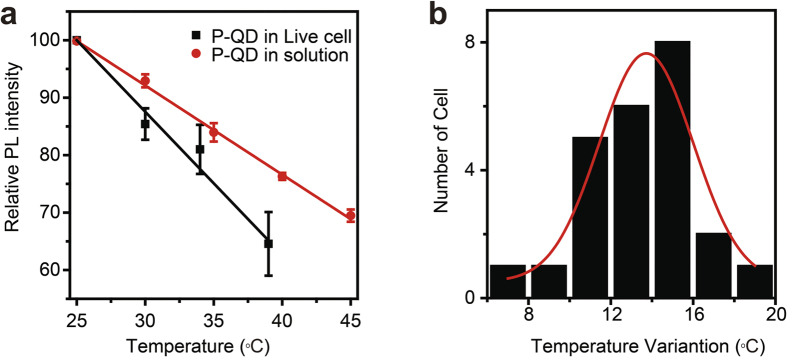
Figure 4.

(a) The PL intensity of P-QD as a function of temperature in solution and live cells. Error bars represent standard deviations obtained from three parallel experiments. (b) Statistics of temperature variations for the 24 P-QD treated cells, showing a bigger variation value of 13.7 ± 0.44 °C than that of environment (9 °C). The red line is the Gaussian fitting curve.
