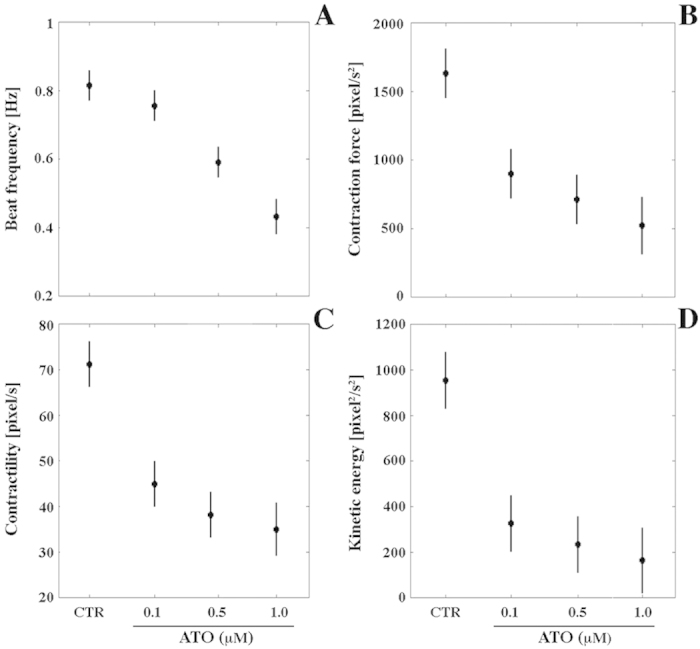
Figure 4. Contractile properties of beating syncytia differentiated from CTR or in the presence of 0.1, 0.5 or 1.0 μM ATO on day 15 of the differentiation process.

(A) Beat frequency [Hz]; (B) Contraction force [pixel/s2]; (C) Contractility [pixel/s]; (D) Kinetic energy [pixel2/s2]. Horizontal bars represent the 95% confidence intervals for the differences between means according to the Least Significant Difference statistical test.
