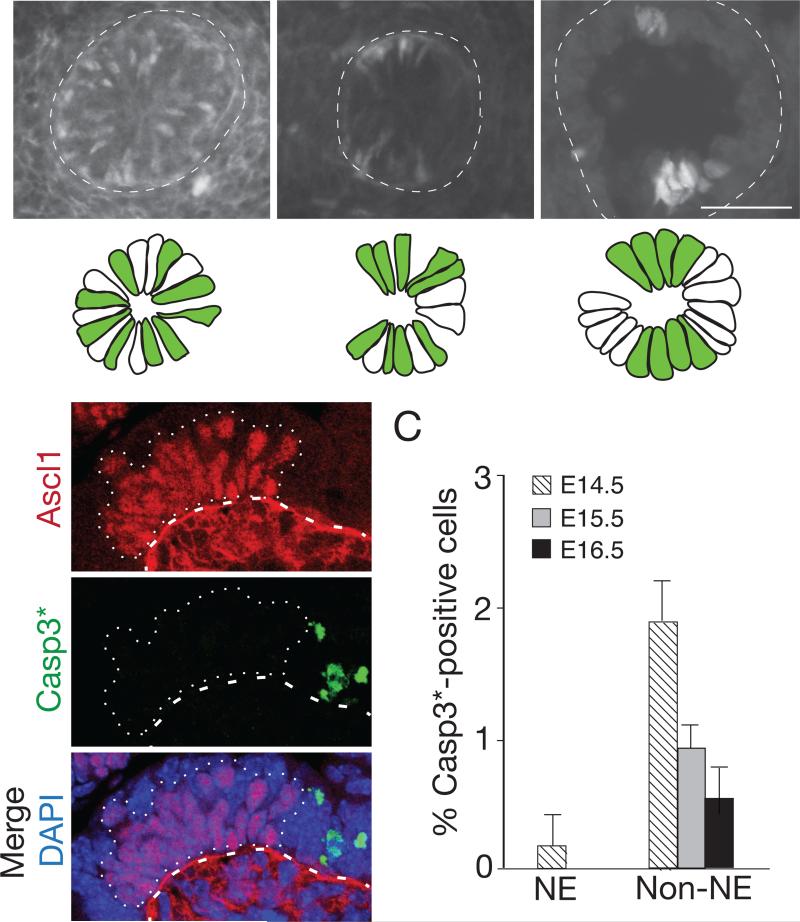
Figure 4. Local clearing of NE cell precursors during cluster formation.
(A) Cross-sections through base of bronchial branch L.V2 at indicated ages of wild type embryos immunostained for Ascl1 (white; green in schematics below) to show NE progenitors forming NEBs L.V2p and L.V2d. Progenitors are initially scattered in “salt and pepper” pattern but, as NEBs form, surrounding regions clear of NE cells. Bar, 10 μm. (B) Sagittal section through developing NEB (dotted outline) in E14 lung co-stained for Ascl1 (red) and activated (cleaved) Caspase 3 (Casp3*, green) to detect apoptotic cells. Note Casp3*-positive cells near, but not within, NEB (dotted outline). Ascl1 signal below basement membrane (dashed line) at E13 is non-specific background. Bar, 10 μm. (C) Quantification of Casp3*-positive NE and non-NE cells in bronchial epithelium at indicated stages. Data shown are percent ± S.E. for proportions; n=589, 406, 322 (NE cells), 1437, 1534, 1122 (non-NE cells) scored at E14.5, 15.5, 16.5, respectively, from 2 embryos at each stage.

