Figure 4.

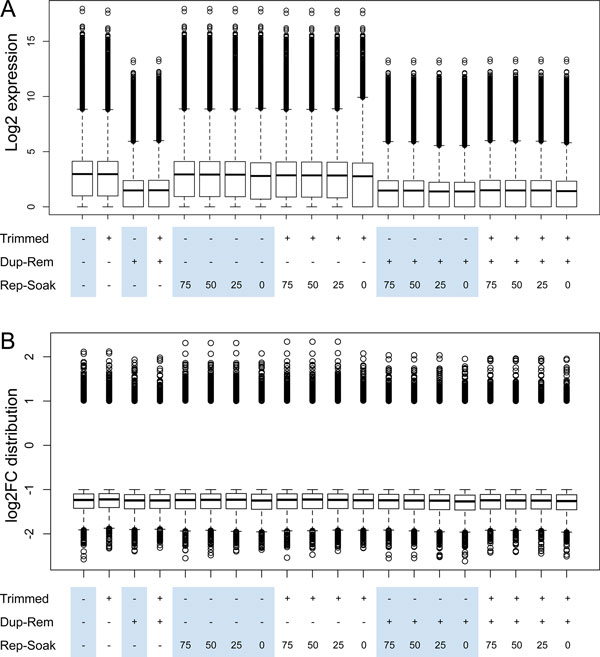
Gene comparison of distribution and expression levels. Effect of data processing on expression (A) and fold change (B) distribution of differentially expressed genes.

Gene comparison of distribution and expression levels. Effect of data processing on expression (A) and fold change (B) distribution of differentially expressed genes.